
Stats Files - 2023

-
-
 Recently Browsing
0 members
Recently Browsing
0 members
- No registered users viewing this page.
-
Demonland Forums


-
-
Match Previews, Reports & Articles

REMATCH by Meggs
The Mighty Demons take on the confident Cats this Saturday night at the recently completed $319 million redeveloped GMHBA Stadium, with the bounce of the ball at 7:15pm. Our last game of 2023 was an agonisingly close 5-point semi-final loss to Geelong, and we look forward to Melbourne turning the tables this week. Practice match form was scratchy for both teams with the Demons losing practice matches to Carlton and Port Adelaide, while the Cats beat Collingwood but then lost to Essendo

WELCOME 2024 by Meggs
It’s been hard to miss the seismic global momentum happening in Women’s sport of late. The Matildas have been playing to record sell-out crowds across Australia and ‘Mary Fowler is God’ is chalked onto footpaths everywhere. WNBA basketball rookie sensation Caitlin Clark has almost single-handedly elevated her Indiana Fever team to unprecedented viewership, attendances and playoffs in the USA. Our female Aussie Paris 2024 Olympians won 13 out of Australia’s all-time record 18 gol
EPILOGUE by Whispering Jack
I sit huddled in near darkness, the only light coming through flickering embers in a damp fireplace, the room in total silence after the thunderstorm died. I wonder if they bothered to restart the game. No point really. It was over before it started. The team’s five star generals in defence and midfield ruled out of the fray, a few others missing in action against superior enemy firepower and too few left to fly the flag for the field marshal defiantly leading his outnumbered army int
PODCAST: Rd 24 vs Collingwood
The Demonland Podcast will air LIVE on Monday, 26th August @ 7:30pm. Join Binman & I as we analyse the Demons loss at the MCG against the Magpies in the Round 24. You questions and comments are a huge part of our podcast so please post anything you want to ask or say below and we'll give you a shout out on the show. If you would like to leave us a voicemail please call 03 9016 3666 and don't worry no body answers so you don't have to talk to a human. Listen & Chat LIVE: ht
VOTES: Rd 24 vs Collingwood
Captain Max Gawn leads Vice Captain Jack Viney and Trent Rivers in the Demonland Player of the Year. The injured pair of Steven May & Christian Petracca round out the Top 5. Your votes please. 6, 5, 4, 3, 2, 1.
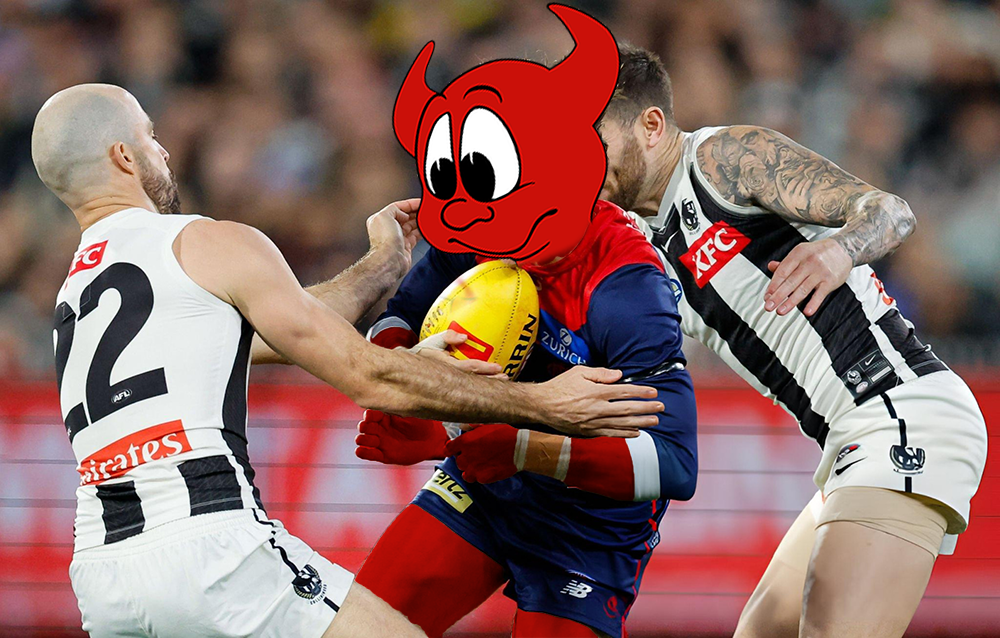
POSTGAME: Rd 24 vs Collingwood
The Dees played insipid, error riddled & uninspiring footy all night and in a lightning delayed match they eventually succumbed to Collingwood by 46 points at the MCG in the final game of the year. Thank God this season is finally over. Bring on 2025.
GAMEDAY: Rd 24 vs Collingwood
It's Game Day and in just a few hours age-old rivals Melbourne and Collingwood, with a history steeped in blood, sweat and unforgettable clashes, will run out onto the hallowed turf of the MCG, to ignite the stadium one last time in season 2024. Let the memory of this season burn.
LAST DANCE by The Oracle
Forget the wishful thinking from Magpie fans who think their team can perform yet another miracle and somehow snatch a place in the 2024 finals series when their team takes on the Demons at the MCG on Friday night. It ain’t gunna happen. They can whistle Dixie through their non-existent front teeth but the fact of the matter is that both teams have run their race. The game is a dead rubber — for each of them, this will be the last dance of the season. And given the history between the two
RED FACED by Whispering Jack
The wind and the hot unseasonable temperatures together with lights turned on mid game at People First Stadium conspired to leave many Suns players and supporters red faced and gasping for air as the Demons proved a number of points on their way to a nine goal triumph on Saturday afternoon in the Carrara sunshine. Melbourne is the only non-Queensland team to taste victory at this venue in 2024. This surely leaves a number of journalists and media mavens red faced after they rushed to pass
-
Tell a friend
-
Podcast

-
-
Podcast


-
Podcast Stream
Open Stream in
New Window

-
-
Support Demonland


 2021 Premiership
 Social Media


 Trade & Draft Forum Non MFC Games
NON-MFC: Finals Week 01
Discussion of all the games in the first week of the AFL Finals Series ...
READ MORE
Demonland | Finals Week 01 
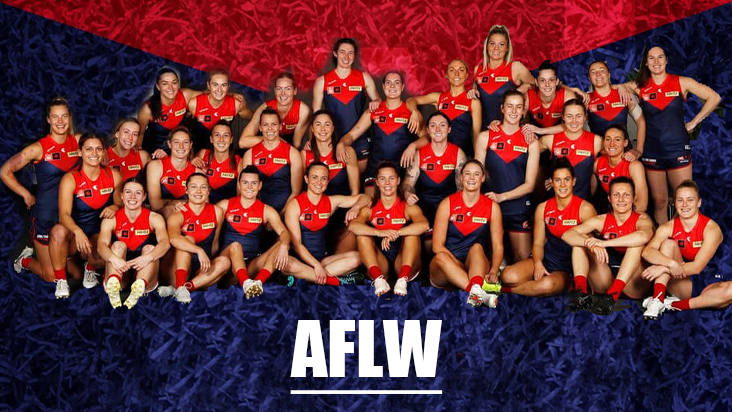
AFLW Match Preview 

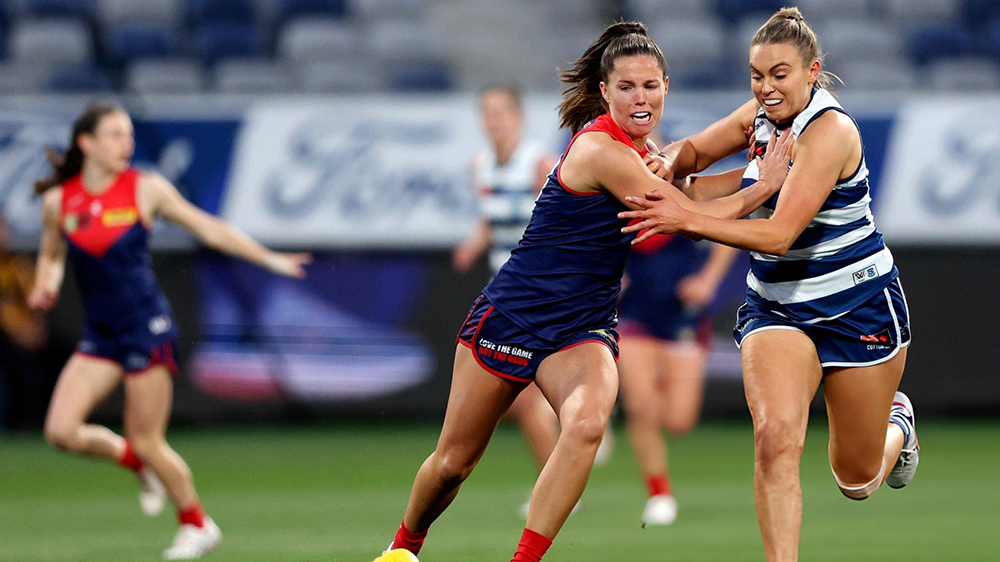
REMATCH by Meggs
The Mighty Demons take on the confident Cats this Saturday night at the recently completed $319 million redeveloped GMHBA Stadium ...
READ MOREDemonland | August 30 
AFLW Season Preview 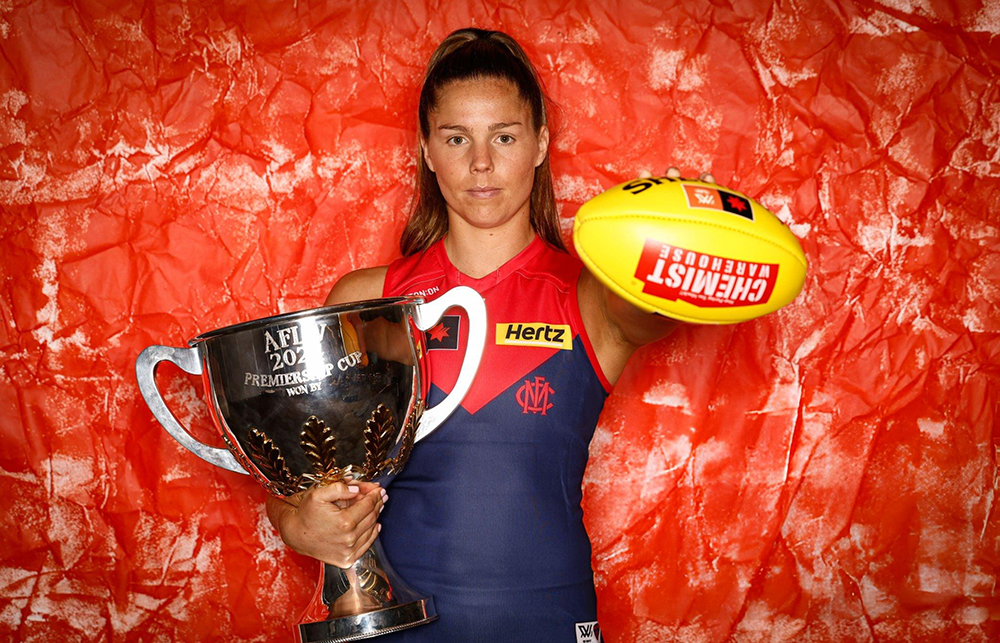
WELCOME 2024 by Meggs
This season promises to be closer than ever before with more teams realistically having a chance of finals. Encouragingly for spectators, the practice matches noticeably displayed higher levels of skills, speed and scoring ...
READ MOREDemonland | August 28
Latest Podcast 
PODCAST: Rd 24 vs Collingwood
The boys analysed our uninspiring, insipid end to the 2024 season before weighing on the Christian Petracca situation ...
LISTENDemonland | August 27 
Match Report 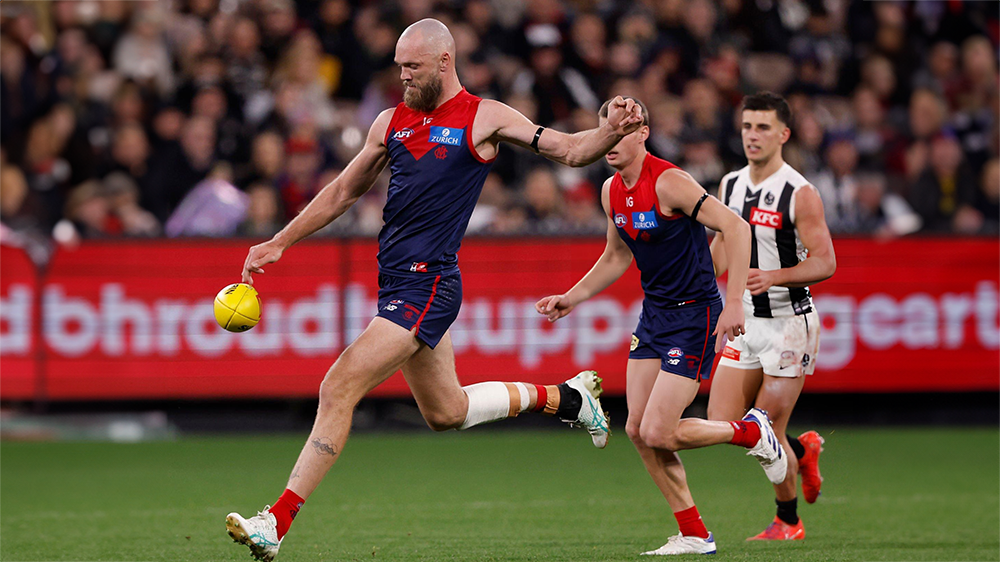
EPILOGUE by Whispering Jack
I sit huddled in near darkness, the only light coming through flickering embers in a damp fireplace, the room in total silence after the thunderstorm died. I wonder if they bothered to restart the game. No point really. It was over before it started ...
READ MOREDemonland | August 24 
Post Game 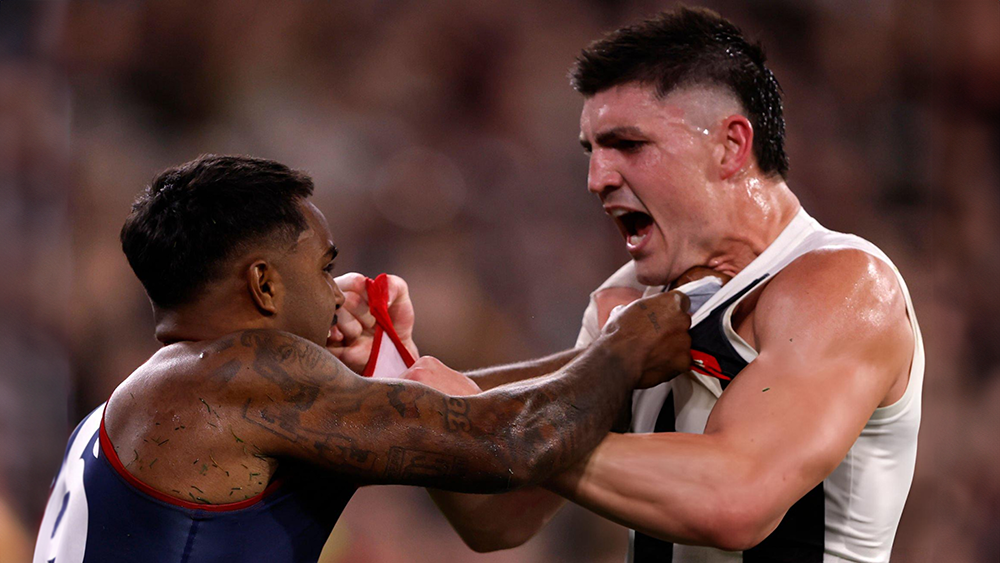
POSTGAME: Rd 24 vs Collingwood
The Dees played insipid, error riddled & uninspiring footy all night and in a lightning delayed match they eventually succumbed to Collingwood by 46 points at the MCG in the final game of the year ...
READ MOREDemonland | August 23 
Votes 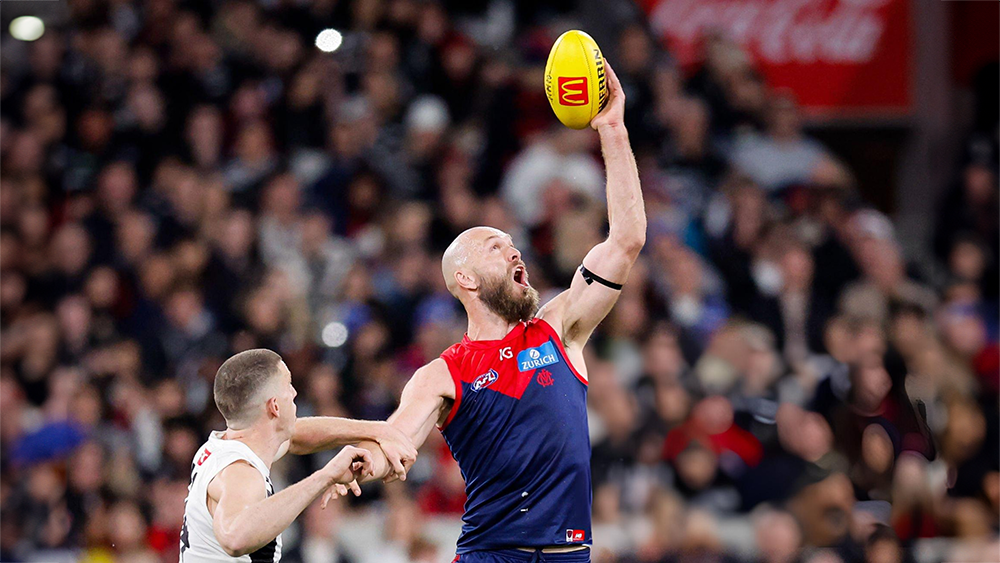
VOTES: Rd 24 vs Collingwood
Captain Max Gawn leads Vice Captain Jack Viney and Trent Rivers in the Demonland Player of the Year. The injured pair of Steven May & Christian Petracca round out the Top 5. Your votes please. 6, 5, 4, 3, 2, 1 ...
READ MOREDemonland | August 23 
Game Day 
GAMEDAY: Rd 24 vs Collingwood
It's Game Day and in just a few hours age-old rivals Melbourne and Collingwood, with a history steeped in blood, sweat and unforgettable clashes, will run out onto the hallowed turf of the MCG, to ignite the stadium one last time in season 2024. Let the memory of this season burn ...
READ MOREDemonland | August 23 
Match Preview 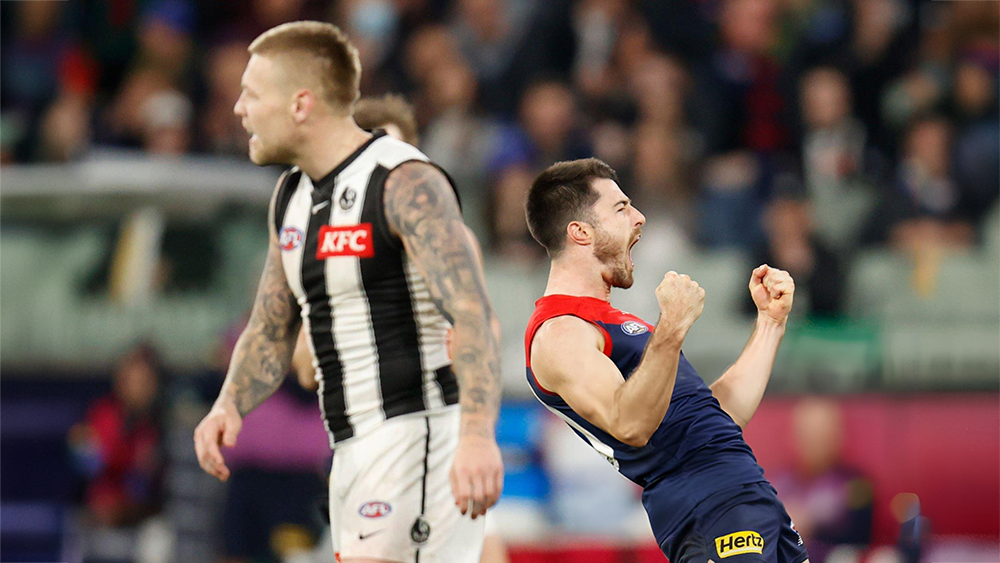
LAST DANCE by The Oracle
Forget the wishful thinking from Magpie fans who think their team can perform yet another miracle and somehow snatch a place in the 2024 finals series when their team takes on the Demons at the MCG on Friday night ...
READ MOREDemonland | August 21
PreGame 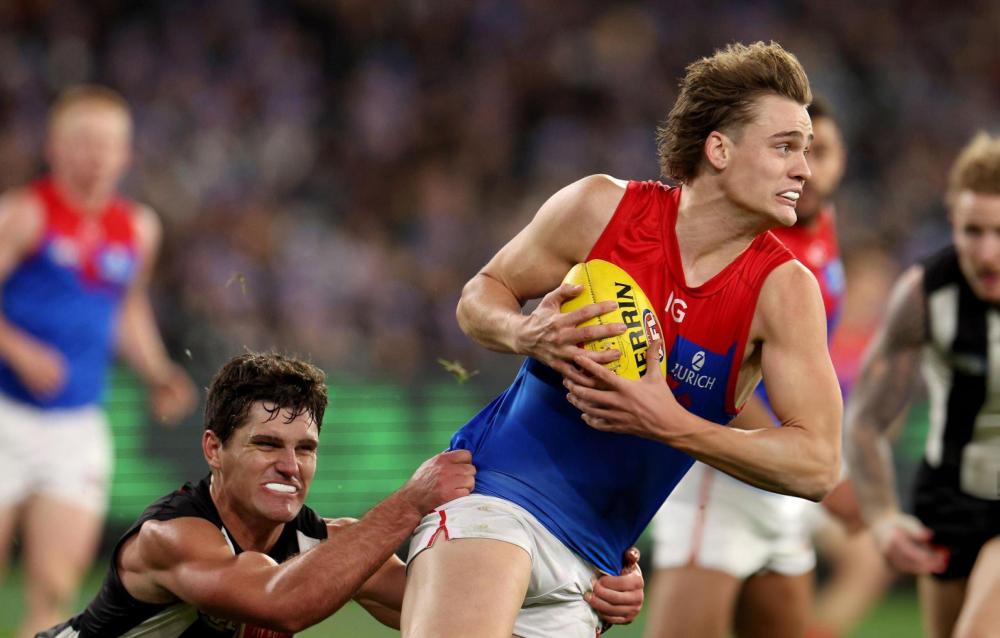
PREGAME: Rd 24 vs Collingwood
The Demons take on the Magpies in a dead rubber in their last match of the 2024 Premiership Season with pride on the line. Who comes in and who goes out? ...
READ MOREDemonland | August 21 
MFC Forum Match Previews & Reports Training Forum  AFLW Forum 2024 Player Sponsorship
 TopicsInjury List
PLAYER INJURY LENGTH 
Steven May Ribs Season 
Clayton Oliver Ribs/Knee Season 
Christian Petracca Ribs Season 
Tom Sparrow Ankle Season 
Charlie Spargo Achilles Season 
Caleb Windsor Ankle Season 
Joel Smith Suspension TBA Player of the Year
PLAYER VOTES 1 
Max Gawn 220 2 
Jack Viney 123 3 
Trent Rivers 112 4 Steven May 104 5 Christian Petracca 97 6 
Alex Neal-Bullen 93 7 
Kysaiah Pickett 81 8 
Ed Langdon 79 9 Clayton Oliver 65 10 
Christian Salem 60
FULL TABLEDemonland Interviews


 Upcoming Events


Recommended Posts
Join the conversation
You can post now and register later. If you have an account, sign in now to post with your account.