
Deelightful Dee
-
Posts
32 -
Joined
-
Last visited
Content Type
Profiles
Forums
Events
Store
Everything posted by Deelightful Dee
-
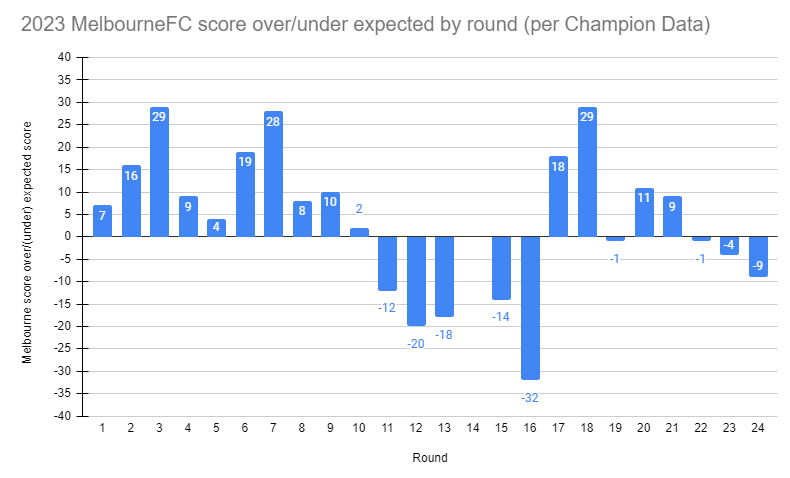
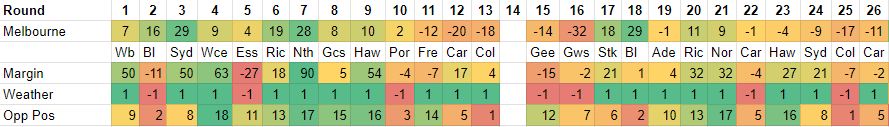
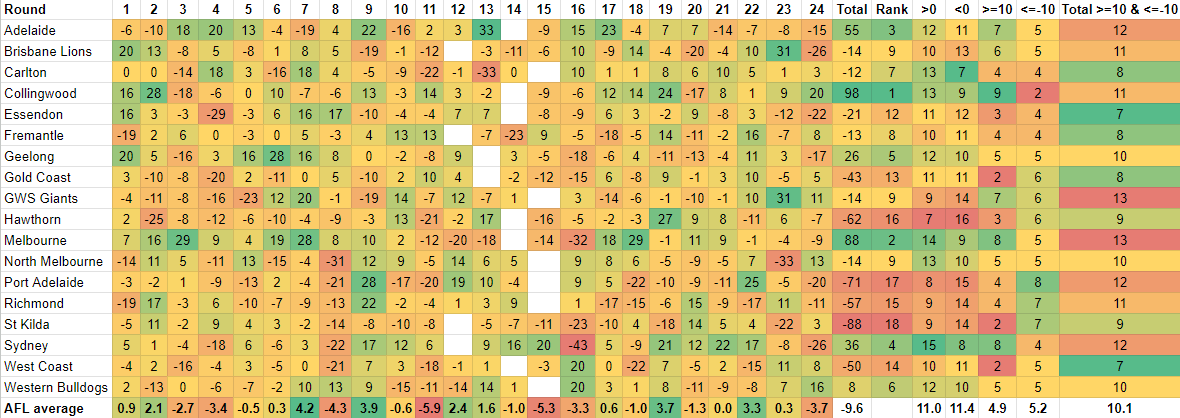
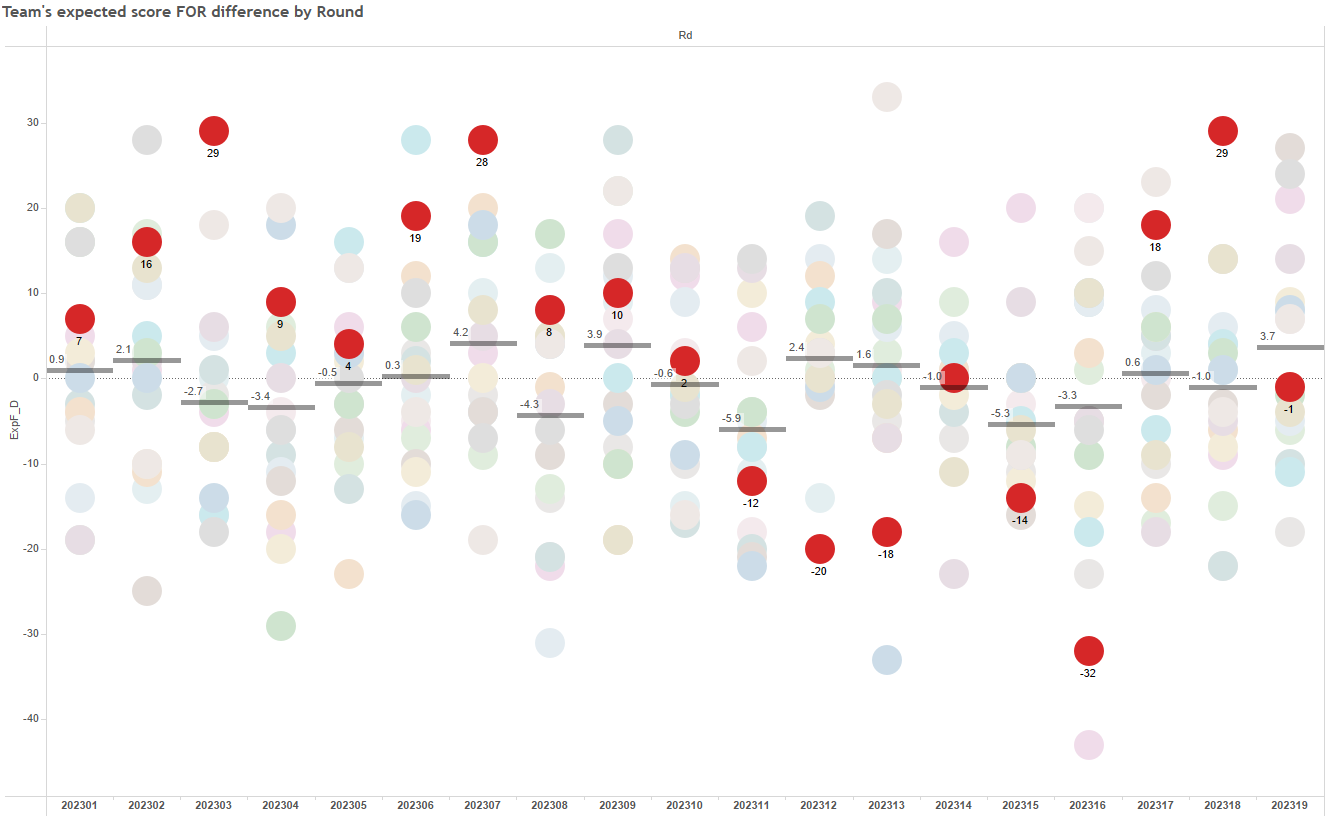
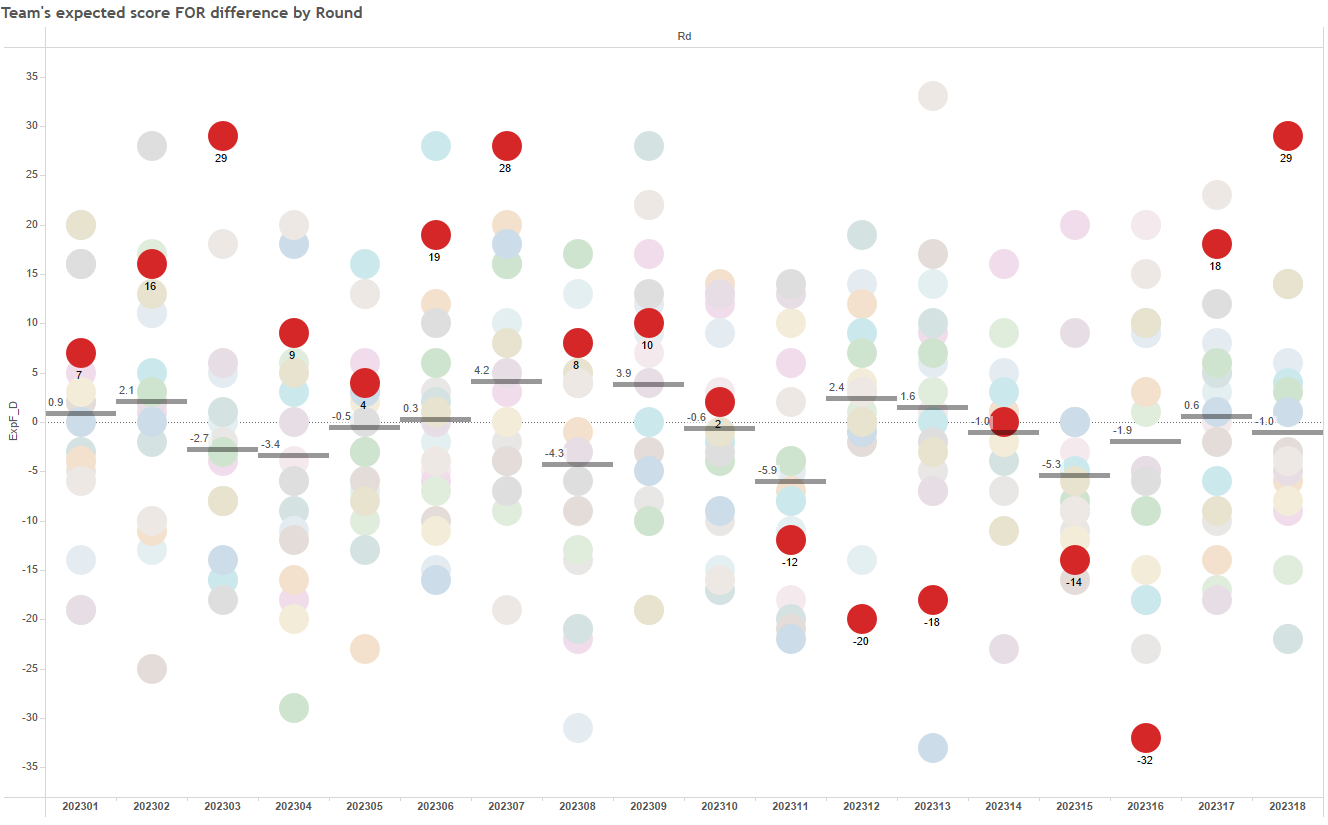
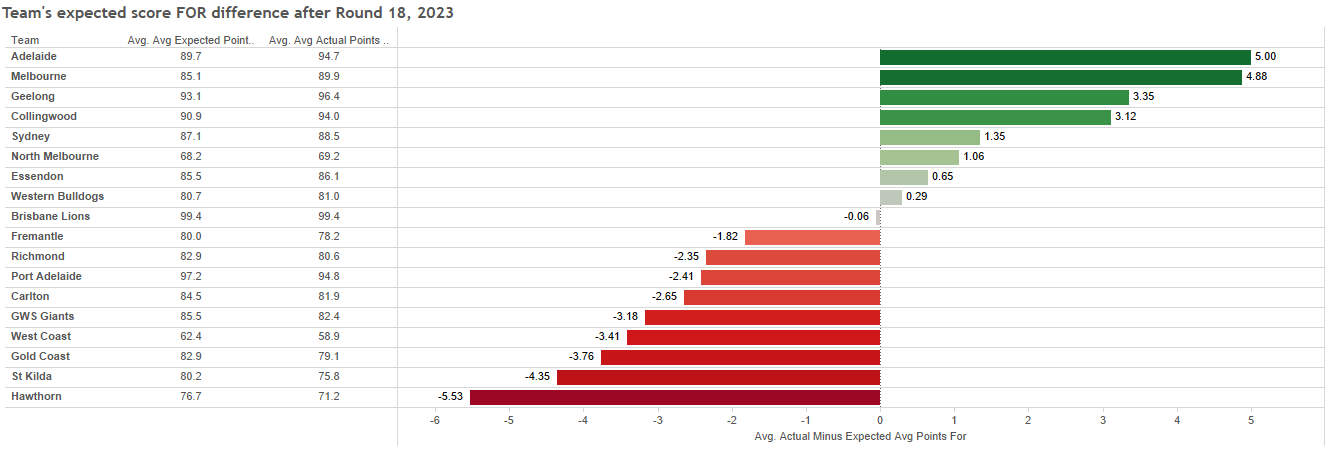
I decided to deep dive into our supposed inaccuracy issues this year to validate or bust this hypothesis. The stats seem to bust this hypothesis. Yes, we had some bad games and patches, and unfortunately some of our worst in our two finals, but over the H&A season we were actually 2nd in scoring above expected (according to Champion Data) with 60 more points, only behind Collingwood who scored 98 points more than expected. We performed better than expected in 14 games (only behind Syd with 15) and worse than expected in 9 games (equal 3rd lowest, Carl best with 7). We performed better than expected by 10 or more points in 8 games (equal second with Syd and 1 behind Coll) and worse than expected by 10 or more points in 5 games (mid table). We did have the most number of such large variances to expected with these 13 games of 10 or more points outside expected score being equal with the Giants. When charting our scoring performance against expected, I think we all know we started hot, went through a lull, picked it up after Alice Springs before starting to struggle again. And unfortunately, the season culminated in our 4th worst (-17 vs Coll) and 7th worst (-11 vs Carl) expected score performances of the season in the finals. To summarise though, I don't buy into the hypothesis that we need to fix our goal kicking or kicking in general. We generated plenty of scoring shots and were above average in converting these across the H&A season when you look at being the second best team above expected score. There are a lot smarter people than I who argue strongly that winning and losing close games involves a lot of luck. Our record in games with margins of 12 points or less: 4-7. Not to mention that last goal of Carlton's on the weekend. The chances of that chain happening the way it did must have been one in a million. That is: 1. Viney's hurried kick going straight Weitering instead of one metre higher and to J.Smith 2. Weitering hitting Hollands lace out after being groggy not long before 3. McVee missing the spoil and flying straight past Docherty rather than spoiling or not even attempting to spoil and just hold up Docherty to give the defence time to set up 4. The ball to Acres falling perfectly for him and, even though he was close, he was only about a foot away from hitting the left hand post. Some things are not meant to be, and as frustrating, bitterly disappointing and utterly heart-breaking Fri night was, we can't change the past. What we, and more importantly the players and coaches, can control is the response to that experience. They can respond by going into their shell, thinking they can't execute under pressure, just keeping on doing what they've been doing. Based on this year though, I think they will respond by reviewing the season as they did last year and evolving and improving just like they did this year. Ultimately, we didn't improve enough and that's the challenge in front of every club, every year. Improve enough, trade and draft the best players possible, learn from this year and strive for excellence so hopefully next year we can be that good that we don't need to rely on luck to win enough games to lift the cup at our home ground in front of all of us.

-
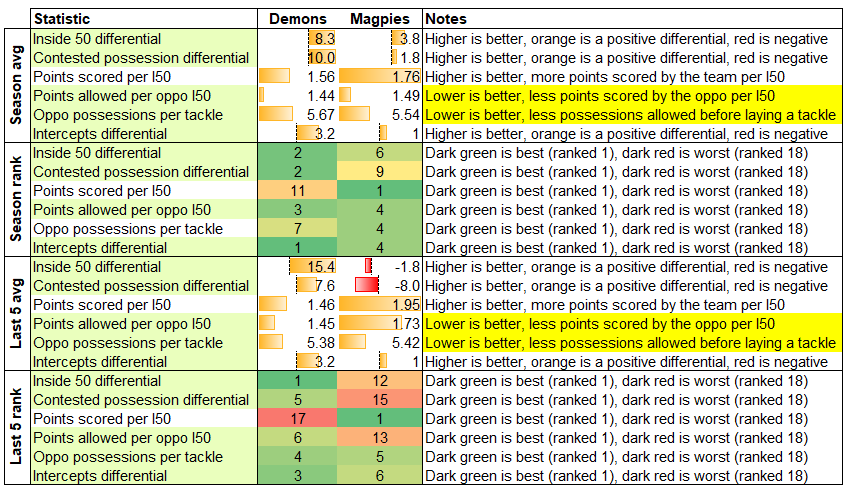
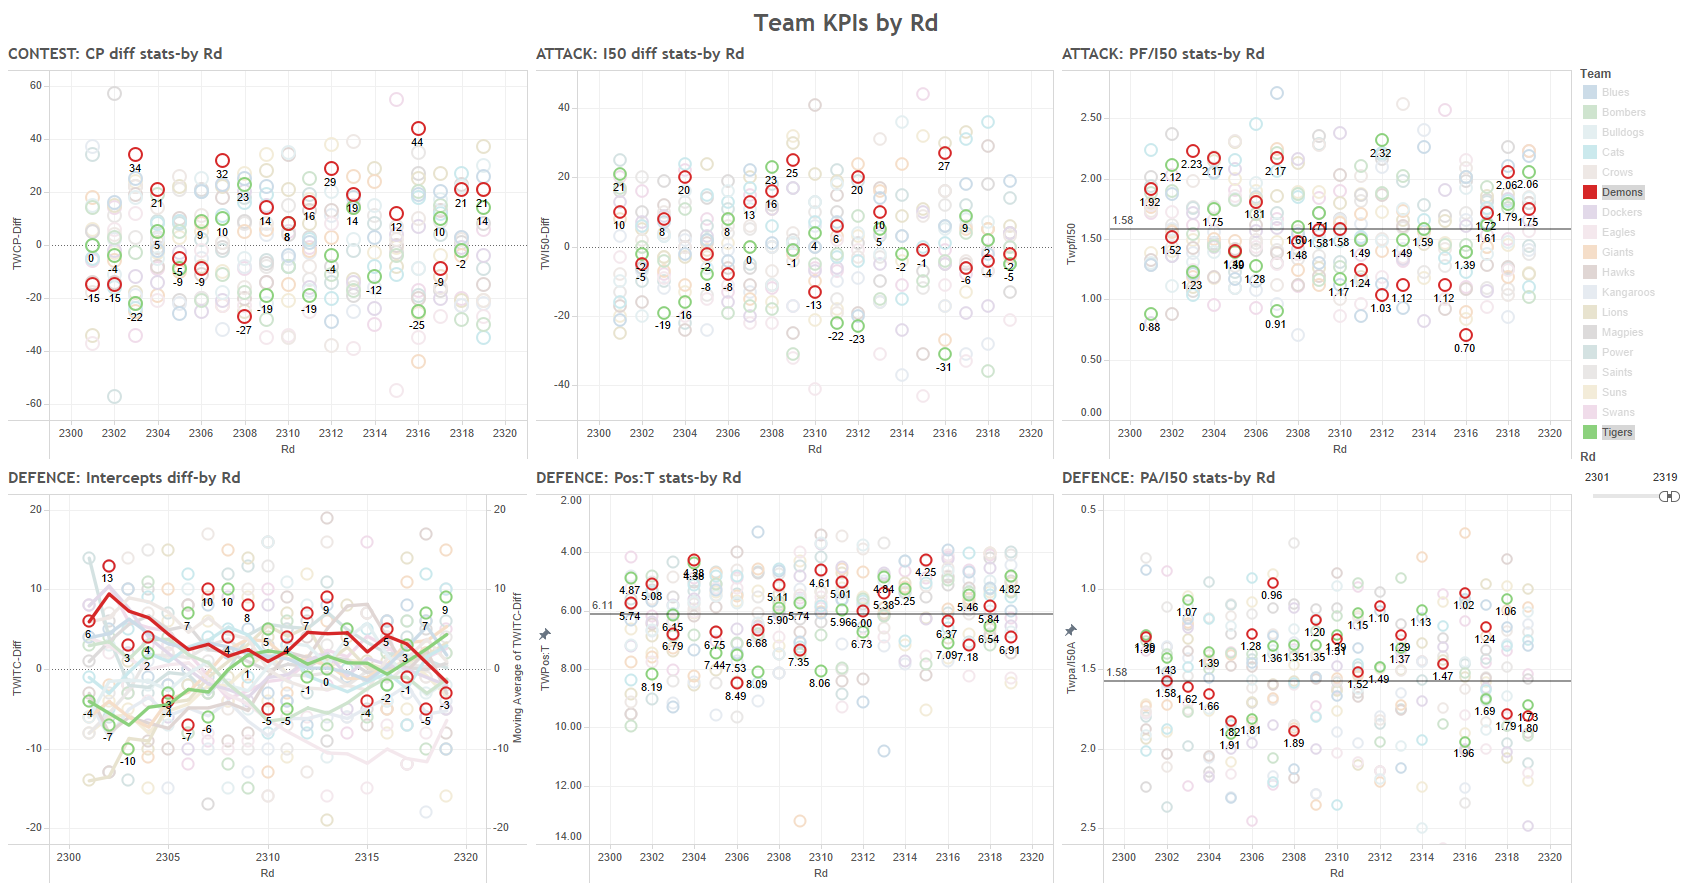
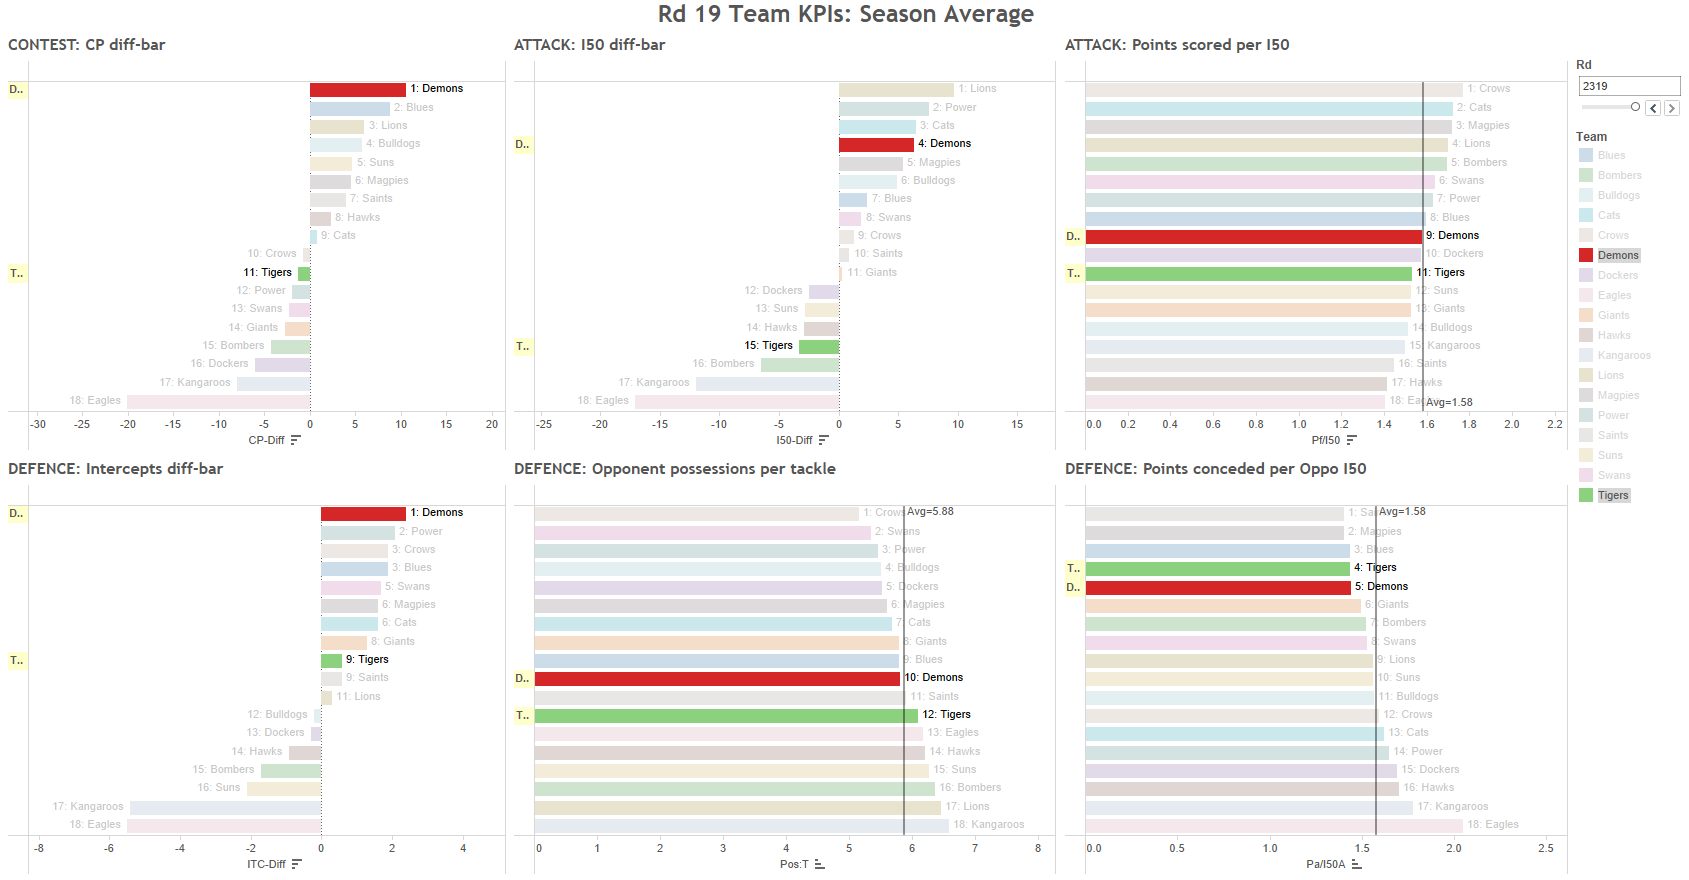
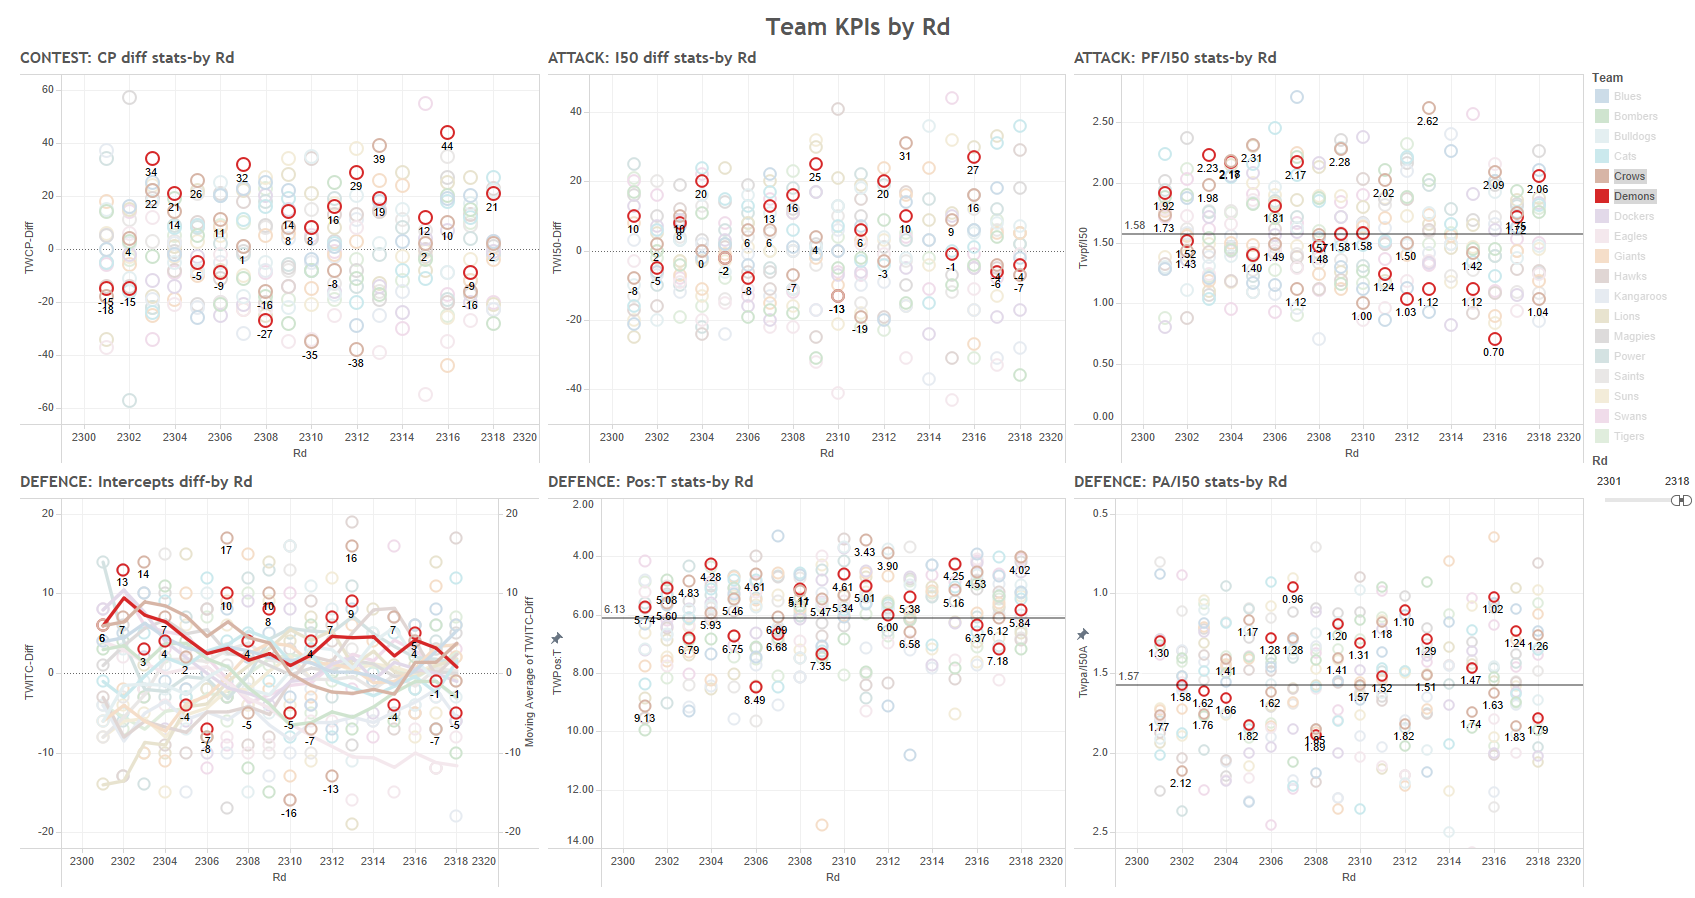
Looking forward to tonight's game with beautful weather and hopefully a possessed Dees side out to atone for last week's loss. Oppo watch The Blues are the best defensive and contest team of the 6 remaining teams over the season as well as over last 5 rounds when considering contested possession differential and how well they defend points from opposotion I50s. On the other hand, their forward half game and attacking efficiency is 5th over the season out of the 6 remaining teams. This profile hasn't changed significantly in the last 5 weeks, so I would expect a similar style tonight. Keys to the game These are the #1 and #2 contested possession differential teams in the final 6, so if one team gets on top in this phase of the game it could spell trouble for the other. The Dees are strong at converting this advantage into I50 differential and this is an area we could exploit the Blues if we can at least break even at the contest. But it might come down to both teams' weakness: attacking efficiency. Both teams seem to be going in with relatively small forward lines which could point to a high speed, ground ball game in the forward line to improve the attacking efficiency tonight. A summary of key stats (green highlight = Dees advantage, no highlight = Blues advantage). It's even 3 to 3 across the season but the Blues have the advantage 4 to 2 over the last 5 games.
-
Prophetic @Kent
-
A couple of key things stand out to me from @WheeloRatings's stats: 1. Our set shot accuracy was the killer in the end. Scoring 4 goals from 14 shots isn't enough (compared to their 7 from 11). However, looking at where these shots were taken as per https://crowdatascience.shinyapps.io/interactive_xscore/ and we can see that all misses were from around 50m or more and the only behind that was greater than 50% chance of a goal was TMac's in the last quarter, but even then that was 52.5% chance. Unfortunately, I think our attacking efficiency issues aren't going to disappear quickly for us. It has been a common issue throughout the year (or longer) and our game style lends itself to it as @binman mentions above. At the end of the day though, I think this style is more conducive to consistent performance that stands up in big games / finals and is more aligned to the strengths of our list so I think the coaches have chosen the right game style for us. However, when we lose, it's invariably going to be because of this. Our last 5 losses (Coll, Carl, GWS, Gee, Freo) have all been due to poor forward conversion even though we had the upper hand defensively and / or in the contest. 2. I'm blown away by the player ratings in the first quarter last night. Our starts have been average to poor since Rd 18 vs Bris (up by 17 at QT) and last night was our 3rd worst Q1 result for the year (behind -26 vs Kan in Rd 21 and -25 vs BL in Rd 2). But the player ratings in Q1 were terrible. Our total player ratings in Q1 were 25 less than the Pies and our only players with more than 3 were Bowey (4.2) and Gawn (3.5). By contrast, they had 11 players with more than 3 with Hill scoring 10.5 (more than 16 of our players for the entire game). Either something was off or the Pies were just really on. I would be surprised if we were off due to the concern of Brayshaw going off as we saw a similar drop off against the Lions in round 2 after Gawn went off with what looked like a serious knee injury. Maybe we have built a team that cares "too much" for each other and such situations negatively impact their ability to perform? In saying that, I'd probably prefer that than vice versa. Interesting to note though, we flipped the script in the last quarter and outscored the Pies by 22 player ratings points (and outscore them by 3 player ratings points by the end of the match).
-
Just took a deeper dive into the pressure factor stats that @WheeloRatings has posted here for Dees games since round 6 and, after breaking these stats into three groups of six games for the year, found some interesting insights to back up @binman's loading theories and aiming to peak later in the year: From rounds 6 to 11, we started strong with an average of 190 in Q1 but fell to 172 and 175 in the middle quarters. Our Q4 pressure factor averaged 187 with an overall match pressure factor of 181. We averaged 8.3 points more than our opponents in Q4 and 0.5 less overall. From rounds 12 to 18 (no game Rd 14), we started slow with an average of 178 in Q1, imroved to 181 in Q2 and peaked at 188 in Q3. However, our Q4 pressure factor fell to an average of 171 with an overall match pressure factor of 179. We averaged 9 points less than our opponents in Q4 and 3.1 less overall. From rounds 19 to 24, we improved our starting pressure with an average of 180 and gradually increased it to 185 in Q2 and Q3. We then peaked with our Q4 pressure factor averaging 188 with an overall match pressure factor of 184. We averaged 1.1 points more than our opponents in Q4 and 2.7 less overall. To note our presure factor extremes, our highest pressure factor in a quarter was in Round 15 vs Cats, Q2 with 224 (we scored 2.7 to 1.3) with our lowest pressure factor in a quarter coming in Round 12 vs Blues, Q4 with 148 (we both scored 1.2). Out highest overall pressure game was Round 22 vs Blues with 200 whlist our lowest pressure games came in Rounds 6 and 18, both with 168. Based on the above Q4 improvement in the last 6 games, if we are (hopefully) in front or close at 3/4 time, I'm feeling pretty confident we'll have petrol in the tank to hold on or run over the top of the Pies tomorrow night!
-
Super excited and terrifyingly nervous for the game this Thu. So much hinges on this, but I think we're in a very good spot. Here's a preview from my perspective: Oppo watch The Pies are the best attacking team in the league over the season as well as over last 5 rounds when considering how well they convert I50s to points. Over the season, they have also been reasonably strong in winning the I50 differential (6th) and preventing opposition teams scoring once they get it inside 50 (4th). However, these two areas have fallen away markedly in the last 5 weeks to 12th and 13th respectively, not to mention their contested possession game dropping from a middling 9th to a struggling 15th. Keys to the game The first key to the game will be the contest: the Dees won this by 19 in their 4 point win over the Pies in Round 13, leading to a solid I50 differential of 10. This meant we didn't have to be awesome in attack and prevented our defence from being under too much pressure. The second key is our defence: we restricted the Pies to 1.27 points per I50 entry (one of their lowest for the year) when they average 1.76 over the season). This comes down to holding our structure in defending their ball movement and it will be interesting to see if we employ the same press up method to disrupt their ball movement as we did earlier in the year. A summary of key stats (green highlight = Dees advantage, no highlight = Pies advantage). Dees have the advantage 5 to 1 both across the season and over the last 5 games. Another interesting element to this game is our ability to run out games. We should be at our endurance peak now and we probably weren't against the Pies in Rd 13 (losing the last quarter by 2, altough poor accuracy didn't help 2.7 to 3.3). The Pies don't seem to be running out games as well as they were earlier in the season: Dees' last 5 4th quarter margins (rounds 20 to 24): +28, +4, -4, +14, +25 (average of +13, won 4, lost 1) Pies' last 5 4th quarter margins (rounds 20 to 24): +2, -6, -16, -12, +5 (average of -5, won 2, lost 3). A different and objective view of what must go right for the Dees to win in the finals (forward line performance) can be found here: https://theshinboner.com/2023/09/01/2023-afl-finals-dossier-melbourne-demons-shinboner-analysis/ What are others' thoughts?
-
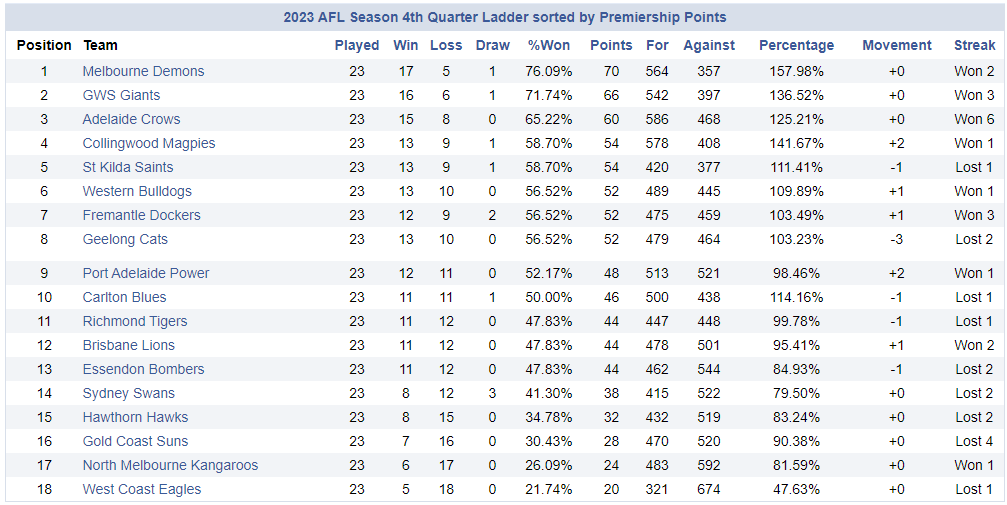
We are the minor premier in last quarters (interesting to see Burgess' Adelaide in 3rd): Source: https://www.footywire.com/afl/footy/ft_ladder?year=2023&pt=PD&st=Q4&sb=p
-
Some key stats that showed how we upped our game after the Swans got out to a 17 point lead two thirds of the way through the 3rd quarter. From the 20 min mark of the 3rd quarter: - We had 19 more contested possessions (71 to 52) - Recorded 38 tackles (15 coming after the 20 min mark of the 3rd quarter to the end of the 3rd quarter alone) - 7 more inside 50s (21 to 14) - Outscored the Swans by 37 (40 to 3) - Scored 48% of the time we went inside 50 at 1.9 points per entry and held the Swans to scoring 21% of the time they went inside 50 at 0.21 points per entry. If we play at that level, we'll be hard to stop. It's a matter of how long we can play at that level now that finals are here!
-
Hawks' uncontested numbers yesterday: Q1: Possessions: 69, Marks: 37 Q2: Possessions: 51, Marks: 15 Q3: Possessions: 68, Marks: 31 Q4: Possessions: 61, Marks: 25 A clear improvement in limiting their uncontested game in Q2, which I think helped turn the game leading to much improved territory and intercept outcomes and eventually scoreboard impact: Q1: I50 diff: -4, Intercept diff: -2, Margin: -6 Q2: I50 diff: +9, Intercept diff: +4, Margin: +8 Q3: I50 diff: +11, Intercept diff: +4, Margin: +11 Q4: I50 diff: +7, Intercept diff: 0, Margin: +14
-
By my records, it's happened 4 times, with a 3-1 win/loss record: R1: WB (lost contested possessions by 15, clearances by 7): won by 50 R2: Bris (lost contested possessions by 14, clearances by 28): lost by 11 R8: GCS (lost contested possessions by 27, clearances by 6): won by 5 R23: Haw (lost contested possessions by 8, clearances by 9): won by 27 We also had a close instance against the Saints: R17: Stk (lost contested possessions by 8, clearances were level): won by 17
-
Turning attention to this week's game and the the Hawks are in strong form. In particular, they have the best inside 50 differential in the league and 2nd best intercept differential in the league over the last 5 weeks. Our intercept differential is the best over the season, but 4th worst over the last 5 weeks (ahead of Bombers, Blues and Suns). If we can win the territory battle and lift our intercept game, I think it will go a long way to getting the win.
-
One stat that caught my eye from the Blues games was the Contested Defensive One on Ones. As @WheeloRatingsnoted, we lost 21.4% of these, but digging deeper we actually had 28 (lost 6) of these CDOoOs which is a season high! We had 27 against Port in Rd 10 (lost 2) and 26 (lost 7) against Bris in Rd 18 with the next highest being 20 (lost 4) against Gee in Rd 15. Interestingly, the only game where we had to defend more CDOoOs since 2016 was Rd 22, 2022 against...Carlton! A big driver of this is losing the I50 battle: -5 vs Blues (after being down 20 to 2, 20 mins into Q1), -5 vs Lions, -1 vs Cats, -13 vs Power. Unuusal that we were +10 vs Blues in Rd 22, 2022 though. Thank goodness for our defence when this happens. In 2023, we are 2nd best in terms of CDOoO loss %, only losing 19.7%, behind Lions on 19.1%, although they've had 69 less CDOoOs to defend. We've actually had the second highest CDOoOs to defend so far this year: 315 (avg of 15 per game) with only GWS recording more (345, 16.4 per game) and well above league avg of 264 (12.6 per game). There is a reasonable gap to 3rd with GWS on 21.4% CDOoO loss rate and Coll in 4th on 21.8%. With a league average loss rate of 24.6%, other contenders are: Blues at 25.1% (11th) and Power at 32.1% (worst). For May to only lose 1 out of 12 on Sat night is remarkable (wet weather helped, but 11 spoils shows how good he was) and Jake Lever did well also, not losing any of his 3! Player CDOoO CDL CDL% Steven May 12 1 8.33% Jake Lever 3 0 0.00% Joel Smith 3 1 33.33% Lachie Hunter 2 0 0.00% Max Gawn 2 2 100.00% Jake Bowey 2 2 100.00% Judd McVee 1 0 0.00% Christian Salem 1 0 0.00% Jack Viney 1 0 0.00% Michael Hibberd 1 0 0.00% Stats courtesy of data provided by @Fryzigg on Twitter/X. Apoloigies for lots of words, but the current size limit on posts doesn't allow my preferred data visualisations.
-
Hi @binman, any chance you can chat to Andy about increasing the max size of files that a post can contain? I can't add my usual visuals with the current max size of 6.58KB. The screenshots I usually add are only around 100KB in size each.
-
Great stuff DD, a bit more context on Hunter from what I can see in his stats (similar to you, still need to watch the replay from Q2 as I was lucky enough to only be able catch Q1😡): 15 contested possessions (#2 for Dees, behind Trac on 16), 5 clearances (#4 for Dees, behind Viney on 10 and Trac/Gus on 6), 6 intercepts (#2 for Dees, behind Lever on 7), 10 ground ball gets (#2 for Dees, behind Trac on 12), 9 score involvements (#3 for Dees, behind Trac on 12 and JVR on 10) and 3 score launches (equal #1 for Dees, with Trac and Gawn). From this, it looks like he contributed strongly all over the ground!
-
Interesting article on ESPN on an NBA style +/- differential for when players are on the ground vs not / not playing: https://www.espn.com.au/afl/story/_/id/38110620/afl-players-most-impact-their-team-looking-nba-style-plus-minus McVee the best for the Dees and only one in the top 20 with +21.61 differential, and surprisingly our opponents this week, Blues, have 3 of the worst 5: #2 Lewis Young with -40.68 (hasn't played recently, spot taken by Kemp who is 4th best with +33.64), #3 J.Motlop with -40.23, #5 Cripps with -33.07. No Dees players in the worst 20!
-
Top 2 up for grabs in #AFLNorthDees! Dees have a big advantage in most areas, with North having better pressure and defence over the last 5 weeks. Can the Dees take this opportunity to control top 2 and a home final?
-
True, although noticing the difference as the game progresses is more what I was thinking to help provide an indication as to how likely we are to win
-
Really interested in this take @binman, so I did some reasinably simple statisticial correlation analysis on the stats I can obtain and identified some counter-intuitive, unexpected relationships between the margin in our game and individual stats. I don't have uncontested mark data, but work it our by subtracting contested marks from total marks. But just so I can get this out before this week's game, I decided to work with total marks. The below table shows our games this year, the value of some key stats and the correlation between the key stats and the game margin. A simple explanation of correlation is that is isthe statistical relationship between the two values. It measures the extent to which two values are linearly related. For example, if both values change at the same rate (one value is 2, 4, 6, 8 and the other value is 1, 2, 3, 4) the correlation would be 1. In the below, it can be seen that the mark differntial and margin are 38.1% correlated, whilst our pure marks in a round are 44.1% correlated and opposition marks in a round are only 20.7% correlated with margin. Unsurprisingly, the goal difference in a round is 98.6% correlated, but what surprised me is that #2 is metres gained diffence in a round with a 92.6% correlation with the next two highest correlations being supercoach and supercoach difference both coming in at 88.9%. So taking last week's game, we had a 133 more metres gained than the Tigers at 3/4 time and ended up with 430 by the final siren. In terms of supercoach difference, we were 42 more at 3/4 time and finished 206 ahead. So keeping an eye on these stats through the game, may be the best predictor of whether we'll win or lose!
-
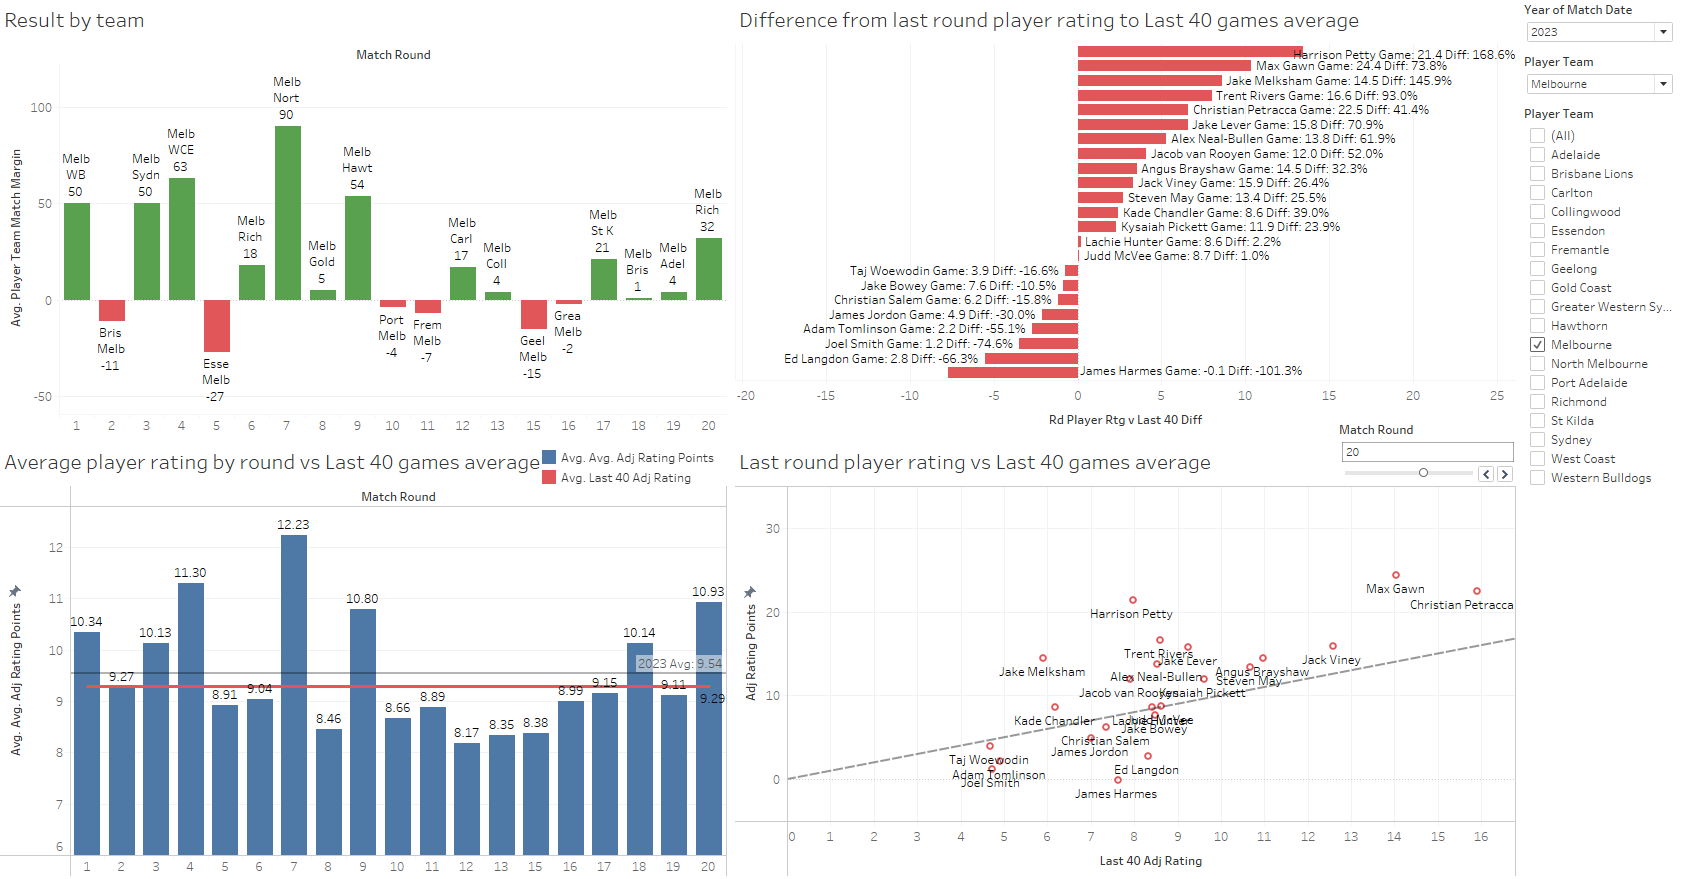
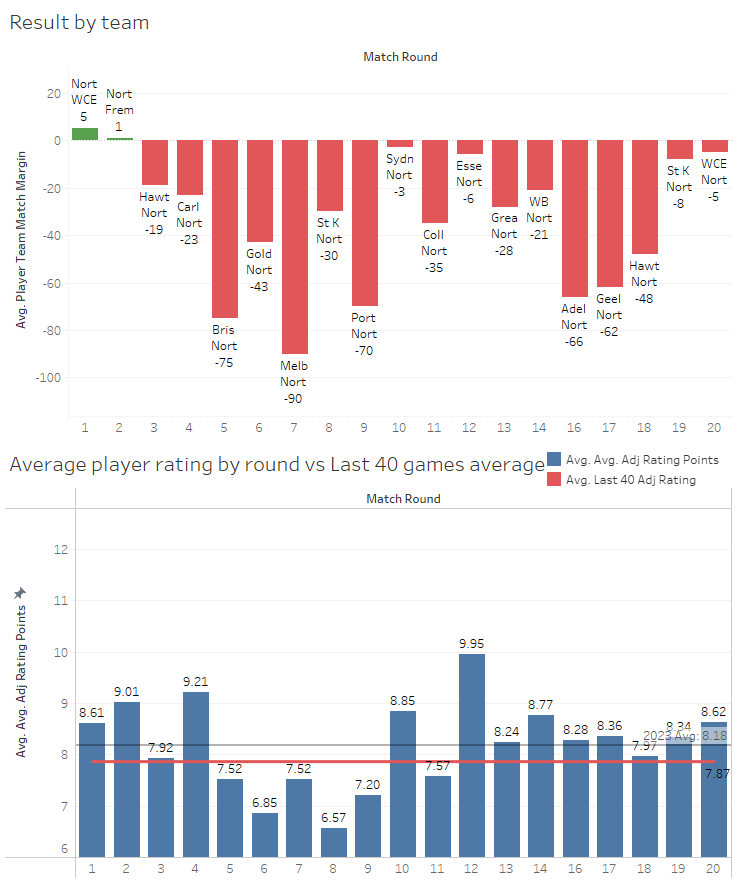
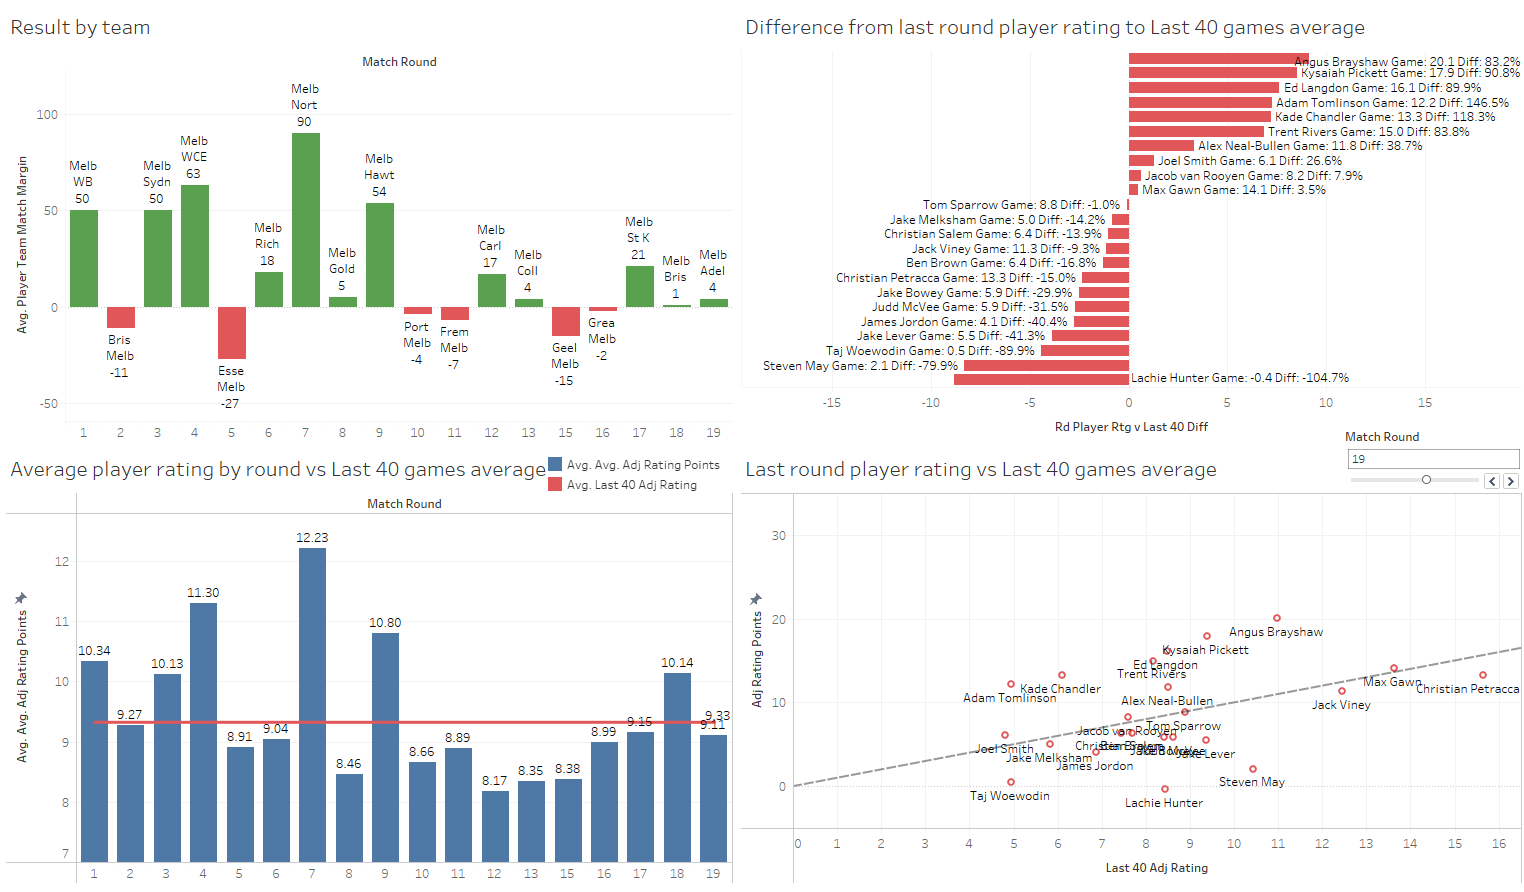
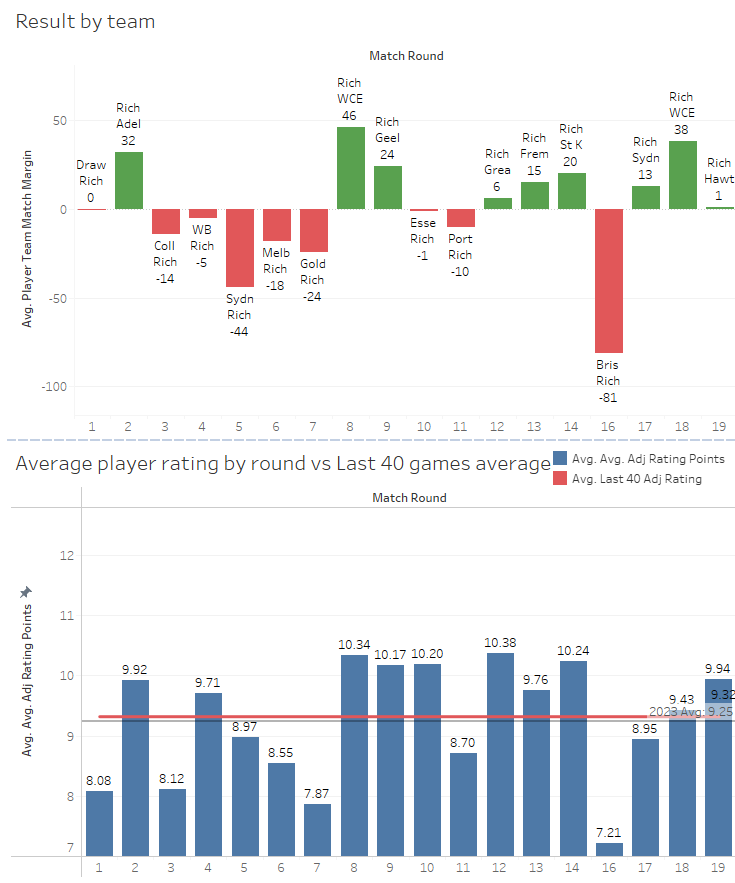
Wow, what a game by the Dees to overcome the Tiges! Based on Champion Data Player Ratings, that was our best game since the North Melbourne smashing in Rd 7 and our 3rd best for the season, reaching 10.93 as a team. An interesting note is that Richmond scored 9.91 which is extremely high for a losing team (2nd highest for a losing team for the round behind Essendon's score of 10.28) and higher than for of the winning teams for the round. Best performers for the Dees aligned to the test with Petty, Gawn and Melsham in the top 3 whilst Rivers was a bit of a surprise to me, coming 4th. For the upcoming game vs North Melbourne, the past ratings indicate this should be a comfortable win for the Dees with a 40 game average of 9.29 compared to North of 7.87. In terms of looking at the teams from last round, North have a lot of inexperienced players with lower ratings across their last 40 games than Melbourne. Their key players are Goldstein (not ideal for the future), LDU, Simpkin, Thomas and Sheezel (unbelievable for a 19 game player). If the Deescan minimise the impact of most of these players I'd be very surprised if North have the depth to replace their usual output.
-
Opportunity is here in #AFLTigersDees: top 2 for Dees, top 8 for Tiges. Dees contest is top notch, but turnover & forward half game is off the boil. Tiges' turnover game is 3rd recently with their attacking efficiency strong but defensively vulnerable. Who will take their chance?
-
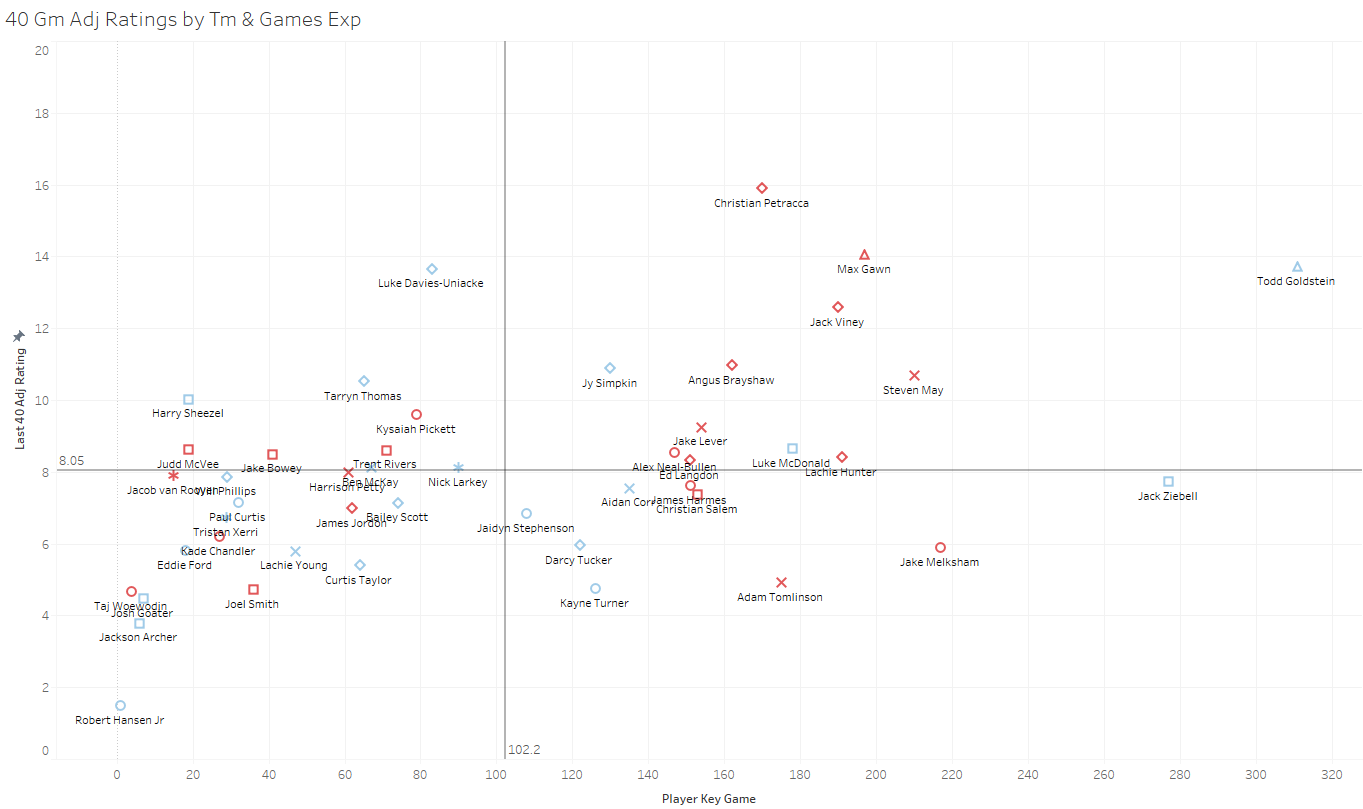
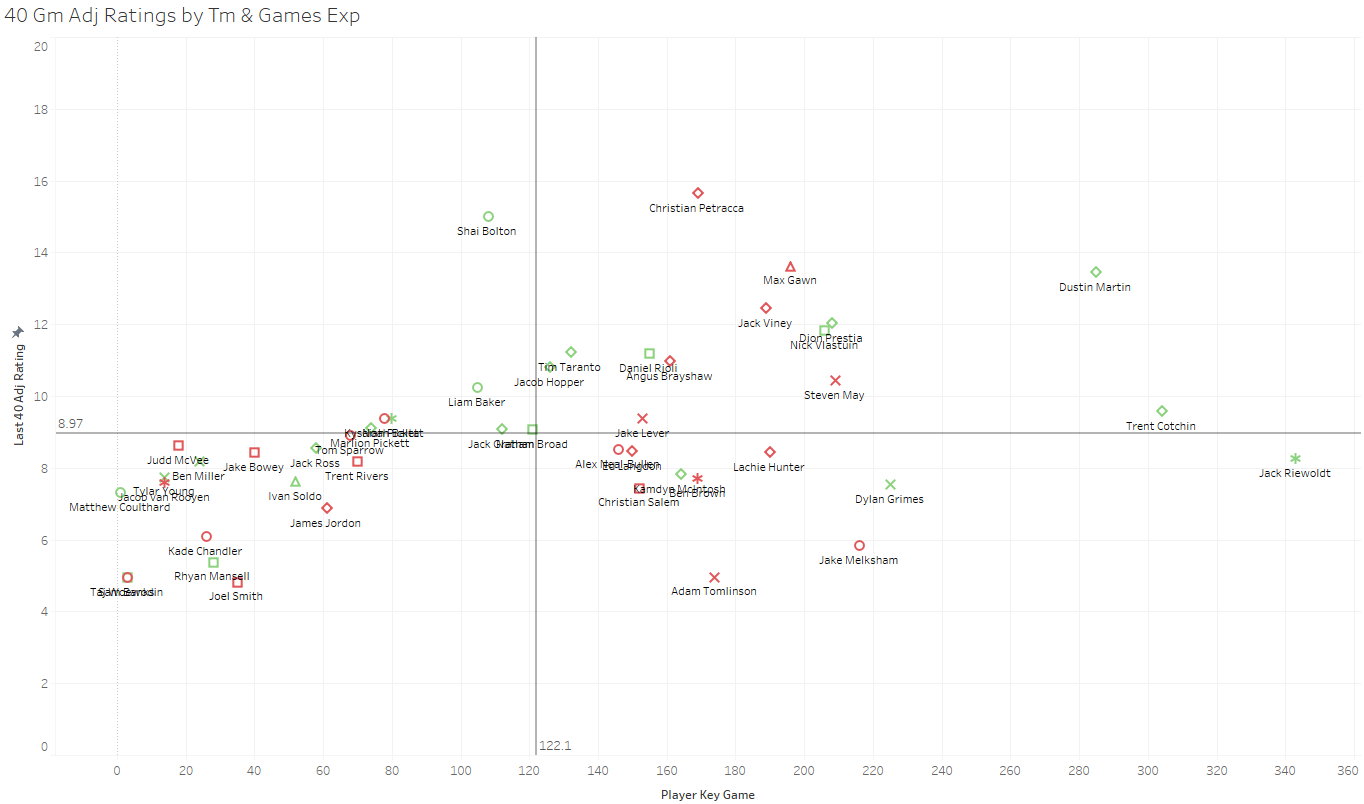
A solid result in Player Ratings (source: @Fryzigg via Twitter) for the Dees last week. Team rating of 9.11, only slitghly below our last 40 game average of 9.33 and more aligned to early season form. Angus, Kozzie and Ed had the biggest jump in pure rating points, although Tomlinson and Chandler's relative increases were the highest. Turning attention to this week's game and Richmond will pose a tough challenge. They are averaging a similar team score to us over the last 40 games (9.32) and have been particularly strong since Round 8 with only one really poor game. I also had a look at how the players who played last week have performed over the last 40 games based on player ratings and considering games experience. It stood out to me that we have a big gap in experience between 80 and 140 games, whilst Richmond have a solid core in this range with Shai Bolton a standout. This may explain some of our inconsistency within games this year. Also, Richmond's experienced stars are still contribtuing strongly, particularly Dusty who has the 4th best average of the two teams. The below also highlights that the Tigers have a more even spread of strong contributors (8 averaging over 10) whilst we tend to rely on 5: Trac, Gawn, Viney, Angus and May.
-
Great to get the win yesterday, but I'd love some less stressful finishes! We were just under our expected score (-1) accoring to Champion Data, whilst the Crows were +7, meaning we would have won by 12 points rather than 4 if both teams kicked to AFL average. I interpret this as our underlying game play was slightly better than the actual score line suggests. Really insightful stats from @WheeloRatings, particularly in relation to our D50 goals. We had a huge spike in these yesterday, with 66 compared to our season average of 36, making up more than two thirds of our score. This has been a trend the last couple of weeks with us scoring 28 vs Lions and 51 vs Saints after struggling vs Giants (11) and Cats (4). This seems to be a function of either a change in game plan, better weather (or playing under a roof) or a reversion to earlier in the year when we were less focused on forward half dominance and happier to play the turnover, quick ball movement game from the defensive half. Not sure how sustainable this is given the further you need to move the ball, the less likely you generally are to score. In saying that, striking a balance and being good at both is probably the way to go depending on what the opposition's weakness is. Our high score does paper over the cracks of our inability to score from F50 this week though with only 2 points coming from this area. The fact that the opposition took 17 intercept marks and we only had 1 tackle inside 50 from 52 entries didn't help this week either, although I sense this is an exception without having these stats readily available.
-
Looking forward to #AFLDeesCrows! Dees' contest is as strong as ever and attack is improving, however, intercepts and I50 diff have dropped off recently. Crows's pressure is their strength but can be exposed defensively and the attack has faded. Can the Dees continue rolling?
-
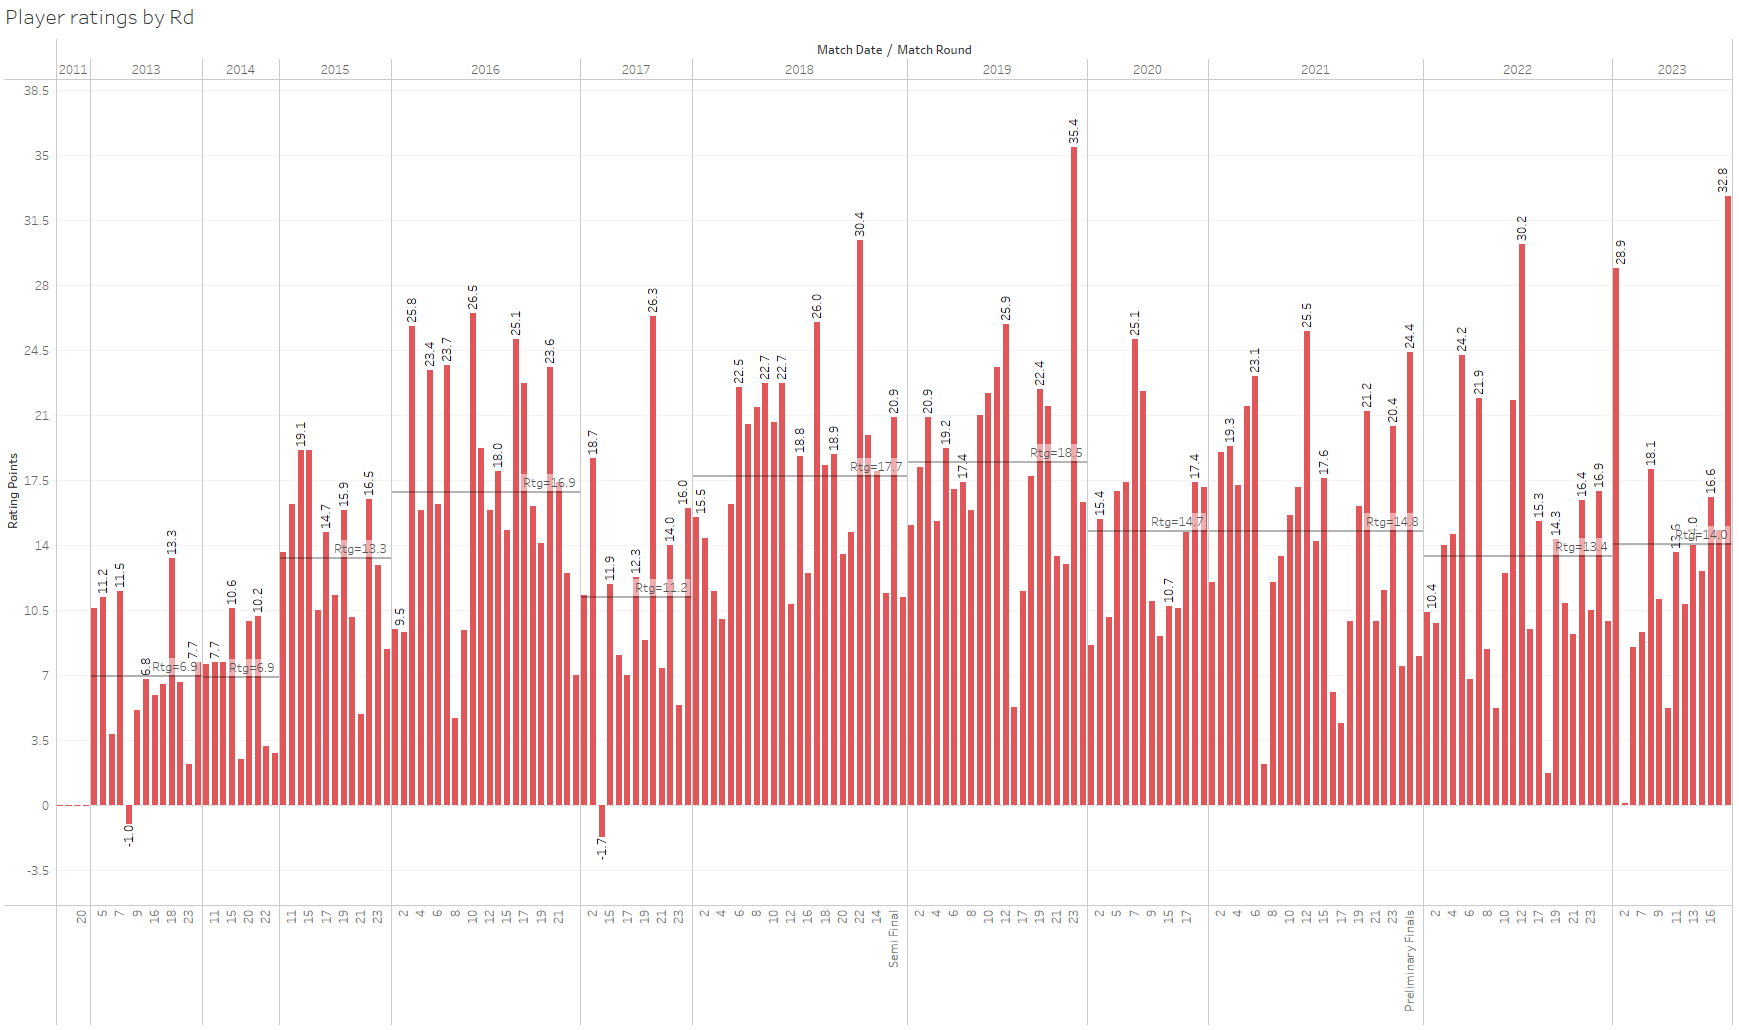
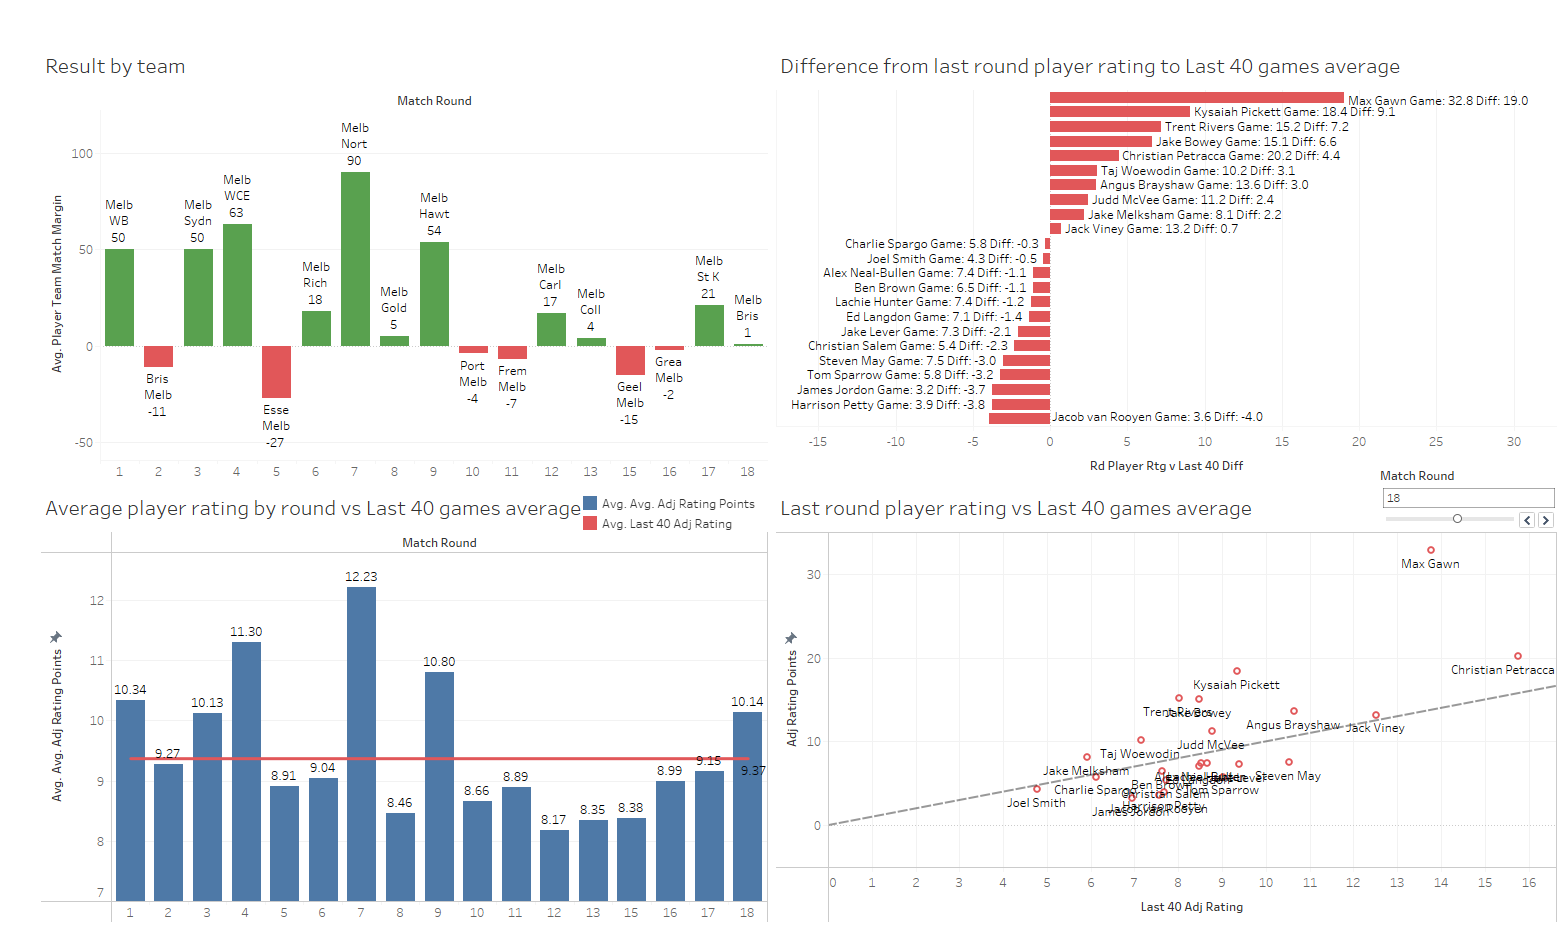
Reviewing the Player Ratings from the win over the Lions and the team ratings continue to climb as we hoped, hitting our highest levels since our win over the Hawks in Round 9. The clear drivers of this were Gawn, Kozzie, Rivers, Bowey and Trac, whilst our worst performers were only slightly off their average. Also worth noting that Brisbane recorded an average rating of 9.9 (compared to our 10.1) per player and therefore played exceptionally well. This is the second highest rating that an opposition has managed against us this season (Bombers were the highest with 10.3 in Rd 5). Taking a closer look at Gawn's superb performance in the context of his career from a Player Ratings perspective and it was his second highest rated game (32.8), behind Round 23 2019 vs North at Blundstone Arena when we lost by 5 points (35.4). Interestingly it was better than his 2021 Prelim Final. His Supercoach score was higher than Rd 23 2019 though: 215 last week vs 212 in 2019.
-
What a win on Fri night, so pumped to have been there to experience it and cheer the team home! Just thought I'd update the expected scores data after the weekend. We equalled our best performance of the year from Round 3 vs Syd with 29 points more than expected (as per Champion Data's formula). This has only been bettered by the Crows when they kicked 33 points more than expected in Round 13 vs Eagles. Speaking of the Crows and coming up against them this week, they have the best differential between actual and expected score this season. This tends to be driven by them taking many very difficult shots and still converting them into goals. Given I haven't really watched them play so far this year, I'm not sure whether this is skill or luck (probably a combinated of both).