


Stats Files - 2023

Featured Replies
Featured Content
-
NON-MFC: 2026 Practice Matches
It's the second week of the 2026 AFL Community Series Practice Matches with games taking place all over the country. Discuss all the games not involving the Demons with the start of the AFL Premiership Season only one week away.- 8 replies
-
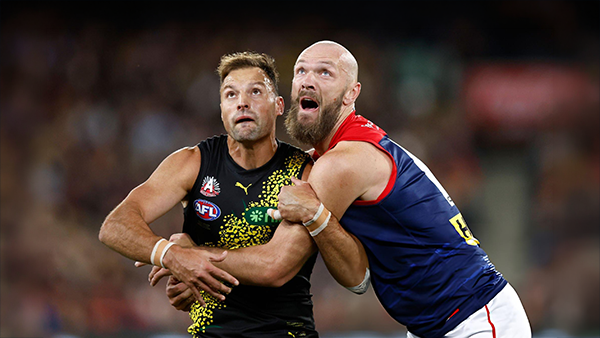
PREGAME: Richmond
The Demons hit the road for their last practice hit out before the start of the 2026 AFL Premiership season when they take on the Tigers at Mars Stadium in Ballarat.- 58 replies
-
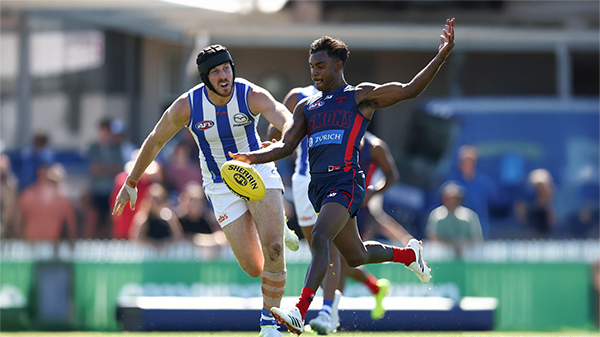
REPORT: North Melbourne
It’s late February. Two teams widely predicted to finish near the foot of the AFL table in 2026 face off against each other in sweltering 30-degree heat deep in outer suburbia in a match simulation with fresh new faces and uneven team numbers. There are no nearby sheep stations on offer; the result promises nothing more than bragging rights for the winner. Nevertheless, the loser appears hopelessly adrift, whereas the other seems to have found its footing after a couple of years of struggle – perhaps a hint at bigger things to come?- 5 replies
-
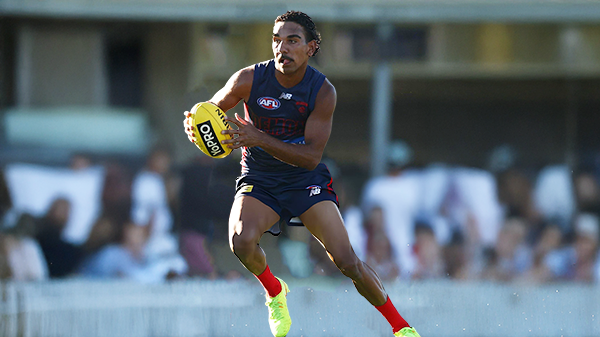
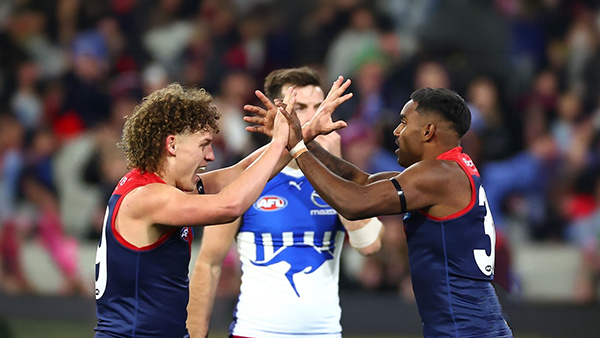
POSTGAME: North Melbourne
It was only a preseason match but the new look Demons spearheaded by new coach Steven King looked impressive as they put on a clinic against perennial cellar-dwellers North Melbourne as they cruised to an 80 point victory at Casey Fields.-
-
- 347 replies
-
-
VOTES: North Melbourne
The 2026 Preseason is upon us and it is time to vote for the inaugural Demonland Player of the Preseason. Please submit your votes for the Practice Match win over North Melbourne. 6, 5, 4, 3, 2 & 1.- 26 replies
-
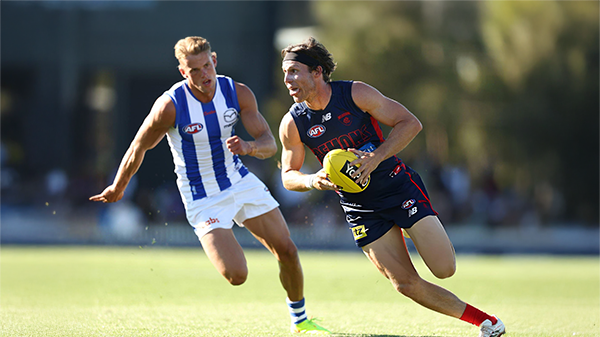
GAMEDAY: North Melbourne
It's finally Game Day and the Demons, under new head coach Steven King, will run out onto the field with a new looking lineup and a brand new midfield when they take on the Kangaroos this afternoon at Casey.-
- 302 replies
-


|

|

|

|
 |
 |
 |
 |
 |
 |
 |
 |
Join the conversation
You can post now and register later. If you have an account, sign in now to post with your account.