


Featured Replies
Featured Content
-
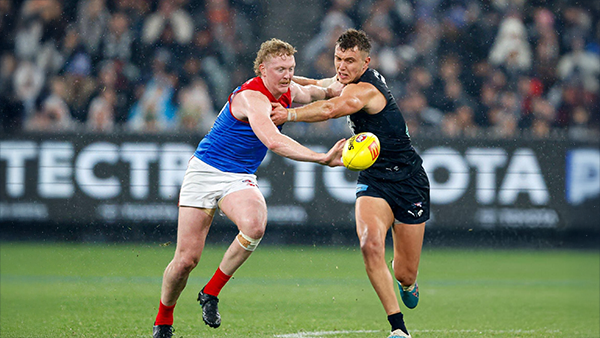
PREVIEW: Carlton
Good evening, Demon fans and welcome back to the Demonland Podcast ... it’s time to discuss this week’s game against the Blues. Will the Demons celebrate Clayton Oliver’s 200th game with a victory? We have a number of callers waiting on line … Leopold Bloom: Carlton and Melbourne are both out of finals contention with six wins and eleven losses, and are undoubtedly the two most underwhelming and disappointing teams of 2025. Both had high expectations at the start of participating and advancing deep into the finals, but instead, they have consistently underperformed and disappointed themselves and their supporters throughout the year. However, I am inclined to give the Demons the benefit of the doubt, as they have made some progress in addressing their issues after a disastrous start. In contrast, the Blues are struggling across the board and do not appear to be making any notable improvements. They are regressing, and a significant loss is looming on Saturday night. Max Gawn in the ruck will be huge and the Demon midfield have a point to prove after lowering their colours in so many close calls.-
-
- 0 replies
-
-
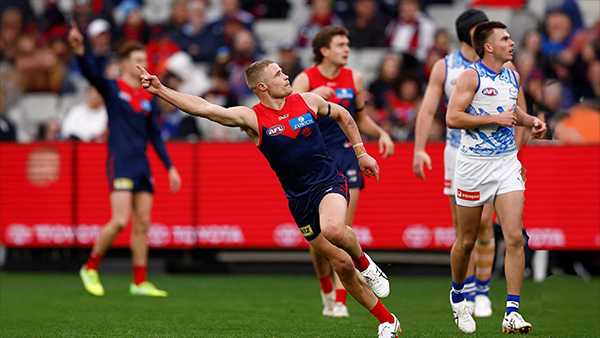
REPORT: North Melbourne
I suppose that I should apologise for the title of this piece, but the temptation to go with it was far too great. The memory of how North Melbourne tore Melbourne apart at the seams earlier in the season and the way in which it set the scene for the club’s demise so early in the piece has been weighing heavily upon all of us. This game was a must-win from the club’s perspective, and the team’s response was overwhelming. The 36 point win over Alastair Clarkson’s Kangaroos at the MCG on Sunday was indeed — roovenge of the highest order!-
-
- 4 replies
-
-
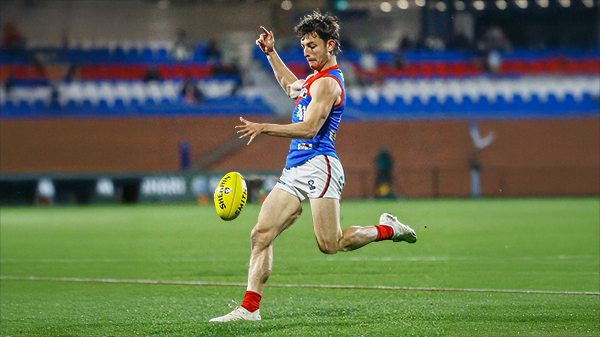
CASEY: Werribee
The Casey Demons remain in contention for a VFL finals berth following a comprehensive 76-point victory over the Werribee Tigers at Whitten Oval last night. The caveat to the performance is that the once mighty Tigers have been raided of many key players and are now a shadow of the premiership-winning team from last season. The team suffered a blow before the game when veteran Tom McDonald was withdrawn for senior duty to cover for Steven May who is ill. However, after conceding the first goal of the game, Casey was dominant from ten minutes in until the very end and despite some early errors and inaccuracy, they managed to warm to the task of dismantling the Tigers with precision, particularly after half time when the nominally home side provided them with minimal resistance.-
-
- 0 replies
-
-
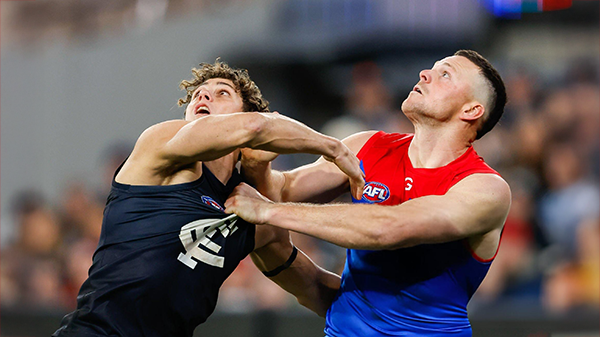
PREGAME: Carlton
The Demons return to the MCG as the the visiting team on Saturday night to take on the Blues who are under siege after 4 straight losses. Who comes in and who goes out?-
-
- 222 replies
-
-
PODCAST: North Melbourne
The Demonland Podcast will air LIVE on Monday, 14th July @ 8:00pm. Join Binman & I as we dissect the Dees glorious win over the Kangaroos at the MCG.
Your questions and comments are a huge part of our podcast so please post anything you want to ask or say below and we'll give you a shout out on the show.
Listen LIVE: https://demonland.com/-
-
- 29 replies
-
-
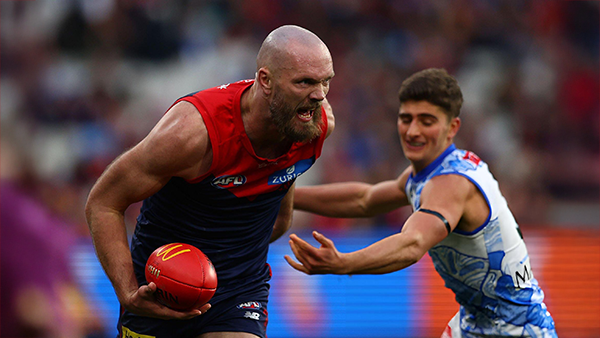
POSTGAME: North Melbourne
The Demons are finally back at the MCG and finally back on the winners list as they continually chipped away at a spirited Kangaroos side eventually breaking their backs and opening the floodgates to run out winners by 6 goals.-
-
- 255 replies
-


|

|

|

|
 |
 |
 |
 |
 |
 |
 |
 |
Join the conversation
You can post now and register later. If you have an account, sign in now to post with your account.