


2024 Expected Score Ladder

Featured Replies
Featured Content
-
REPORT: Richmond
Mars is not usually a place known for lighting strikes but on Friday evening it happened twice in the vicinity of the stadium in Ballarat that carries the name and is a half completed building site with limited capacity for spectators.-
- 4 replies
-
-
POSTGAME: Richmond
The Dees ran another clinic for the second week in a row as they easily accounted for the Tigers in the lightning interrupted shortened match at Mars Stadium in Ballarat.-
-
- 118 replies
-
-
VOTES: Richmond
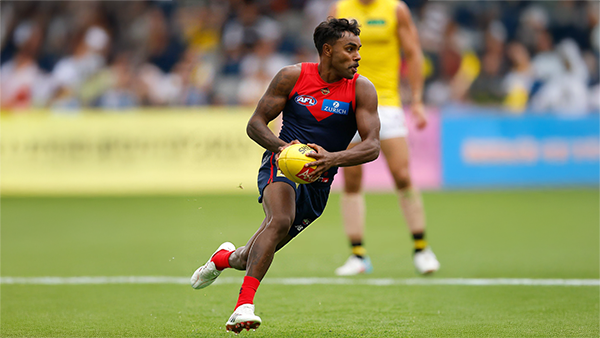
Kozzy Pickett was the man of the match last week and has a vote lead over backup ruck Max Heath who didn't play this week and 5 votes over former Saint Jack Steele. Who gets the votes in this weeks shortened match win over the Tigers? Your votes please. 6, 5, 4, 3, 2 & 1.-
-
- 15 replies
-
-
GAMEDAY: Richmond
It's Game Day and the 2026 AFL Premiership season is almost upon us as the Demons take to the field for their final practice match before the first ball is kicked in anger in 16 days time. What are you expecting to see from the Dees today as they take on the Tigers at Mars Stadium in Ballarat?-
-
- 337 replies
-
-
NON-MFC: 2026 Practice Matches
It's the second week of the 2026 AFL Community Series Practice Matches with games taking place all over the country. Discuss all the games not involving the Demons with the start of the AFL Premiership Season only one week away.-
-
- 116 replies
-
-
PREGAME: Richmond
The Demons hit the road for their last practice hit out before the start of the 2026 AFL Premiership season when they take on the Tigers at Mars Stadium in Ballarat.-
-
- 146 replies
-


|

|

|

|
 |
 |
 |
 |
 |
 |
 |
 |
Join the conversation
You can post now and register later. If you have an account, sign in now to post with your account.