

-
-
 Recently Browsing
0 members
Recently Browsing
0 members
- No registered users viewing this page.
-
Demonland Forums


-
-
Match Previews, Reports & Articles

GOLDIE'S METTLE by Meggs
On a perfect night for football at the home of the Redlegs, Norwood Oval, it was the visiting underdogs Melbourne who led all night and hung on to prevail in a 2-point nail-biter. In the previous round St Kilda had made it a tough physical game to help restrict Adelaide from scoring and so Mick Stinear set a similar strategy for his team. To win it would require every player to do their bit on the field plus a little bit of luck. Fifty game milestoner Sinead Goldrick epitomised

2024 Player Reviews: #19 Josh Schache
Date of Birth: 21 August 1997 Height: 199cm Games MFC 2024: 1 Career Total: 76 Goals MFC 2024: 0 Career Total: 75 Games CDFC 2024: 12 Goals CDFC 2024: 14 Originally selected to join the Brisbane Lions with the second pick in the 2015 AFL National Draft, Schache moved on to the Western Bulldogs and played in their 2021 defeat to Melbourne where he featured in a handful of games over the past two seasons. Was unable to command a
2024 Player Reviews: #21 Matthew Jefferson
Date of Birth: 8 March 2004 Height: 195cm Games CDFC 2024: 17 Goals CDFC 2024: 29 The rangy young key forward was a first round pick two years ago is undergoing a long period of training for senior football. There were some promising developments during his season at Casey where he was their top goal kicker and finished third in its best & fairest.
2024 Player Reviews: #23 Shane McAdam
Date of Birth: 28 May 1995 Height: 186cm Games MFC 2024: 3 Career Total: 53 Goals MFC 2024: 1 Career Total: 73 Games CDFC 2024: 11 Goals CDFC 2024: 21 Injuries meant a delayed start to his season and, although he showed his athleticism and his speed at times, he was unable to put it all together consistently. Needs to show much more in 2025 and a key will be his fitness.
2024 Player Reviews: #43 Kyah Farris-White
Date of Birth: 2 January 2004 Height: 206cm Games CDFC 2024: 4 Goals CDFC 2024: 1 Farris-White was recruited from basketball as a Category B rookie in the hope of turning him into an AFL quality ruckman but, after two seasons, the experiment failed to bear fruit.
2024 Player Reviews: #44 Luker Kentfield
Date of Birth: 10 September 2005 Height: 194cm Games CDFC 2024: 9 Goals CDFC 2024: 5 Drafted from WAFL club Subiaco in this year’s mid season draft, Kentfield was injured when he came to the club and needs a full season to prepare for the rigors of AFL football.
REDLEG PRIDE by Meggs
Hump day mid-week footy at the Redlegs home ground is a great opportunity to build on our recent improved competitiveness playing in the red and blue. The jumper has a few other colours this week with the rainbow Pride flag flying this round to celebrate people from all walks of life coming together, being accepted. AFLW has been a benchmark when it comes to inclusivity and a safe workplace. The team will run out in a specially designed guernsey for this game and also the following week
REDEEMING by Meggs
It was such a balmy spring evening for this mid-week BNCA Pink Lady match at our favourite venue Ikon Park between two teams that had not won a game since round one. After last week’s insipid bombing, the DeeArmy banner correctly deemanded that our players ‘go in hard, go in strong, go in fighting’, and girl they sure did! The first quarter goals by Alyssa Bannan and Alyssia Pisano were simply stunning, and it was 4 goals to nil by half-time. Kudos to Mick Stinear.
REDEEM by Meggs
How will Mick Stinear and his dwindling list of fit and available Demons respond to last week’s 65-point capitulation to the Bombers, the team’s biggest loss in history? As a minimum he will expect genuine effort from all of his players when Melbourne takes on the GWS Giants at Ikon Park this Thursday. Happily, the ground remains a favourite Melbourne venue of players and spectators alike and will provide an opportunity for the Demons to redeem themselves. Injuries to star play
-
Tell a friend
-
Podcast

-
-
Podcast


-
Podcast Stream
Open Stream in
New Window

-
-
Support Demonland


 2021 Premiership
 Social Media


 Trade & Draft Forum Upcoming Events
 Trade Week Ends
Wednesday 16th October 2024
@ 03:00pm
2025 Pre-Season Begins
Monday 11th November 2024
@ 10:00am
AFLW Match Report 

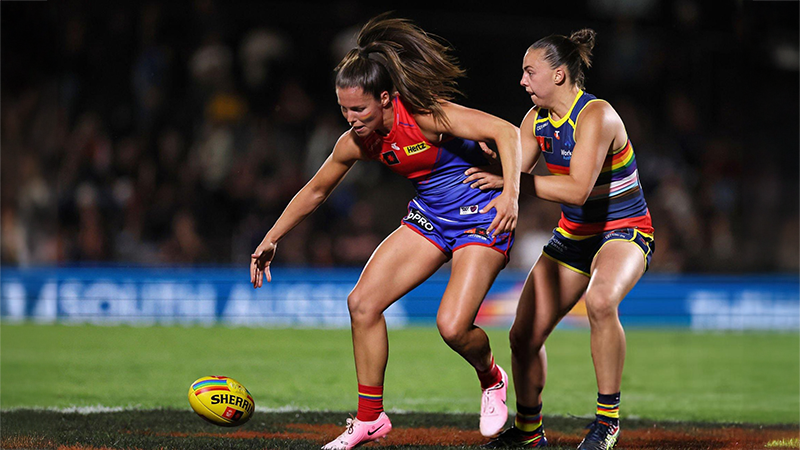
GOLDIE'S METTLE by Meggs
On a perfect night for football at the home of the Redlegs, Norwood Oval, it was the visiting underdogs Melbourne who led all night and hung on to prevail in a 2-point nail-biter ...
READ MORE
Demonland | October 11 
AFLW Match Preview 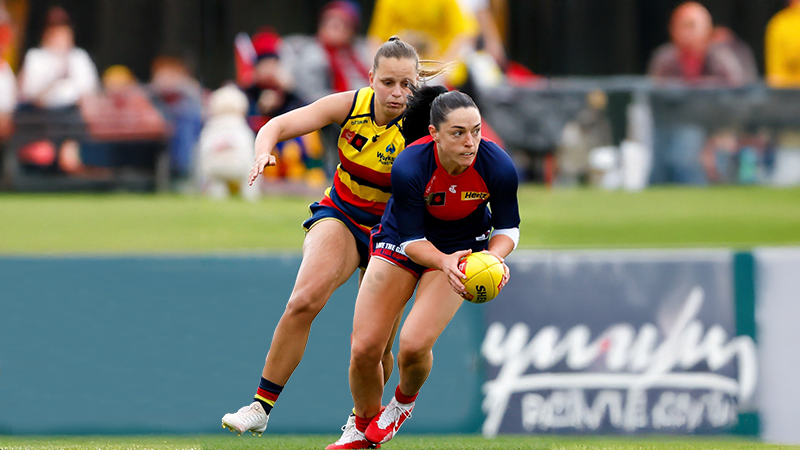
REDLEG PRIDE by Meggs
Hump day mid-week footy at the Redlegs home ground is a great opportunity to build on our recent improved competitiveness playing in the red and blue ...
READ MOREDemonland | October 09 
AFLW Season Preview 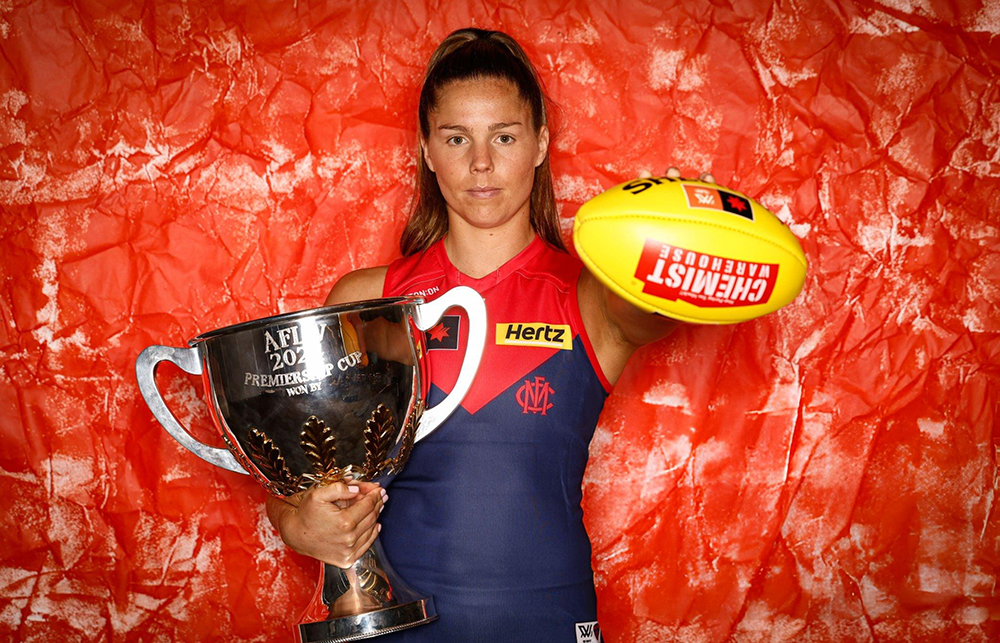
WELCOME 2024 by Meggs
This season promises to be closer than ever before with more teams realistically having a chance of finals. Encouragingly for spectators, the practice matches noticeably displayed higher levels of skills, speed and scoring ...
READ MOREDemonland | August 28
Latest Podcast 
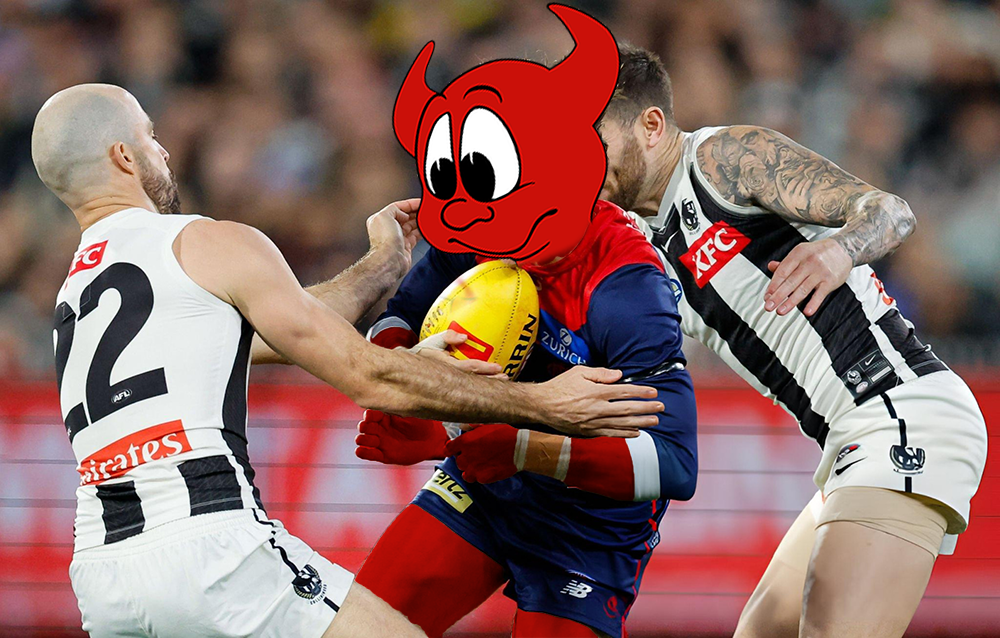
PODCAST: Rd 24 vs Collingwood
The boys analysed our uninspiring, insipid end to the 2024 season before weighing on the Christian Petracca situation ...
LISTENDemonland | August 27 
MFC Forum Match Previews & Reports Training Forum  AFLW Forum 2024 Player Sponsorship
 TopicsInjury List
PLAYER INJURY LENGTH 
Steven May Ribs Season 
Clayton Oliver Ribs/Knee Season 
Christian Petracca Ribs Season 
Tom Sparrow Ankle Season 
Charlie Spargo Achilles Season 
Caleb Windsor Ankle Season 
Joel Smith Suspension TBA Player of the Year
PLAYER VOTES 1 
Max Gawn 220 2 
Jack Viney 123 3 
Trent Rivers 112 4 Steven May 104 5 Christian Petracca 97 6 
Alex Neal-Bullen 93 7 
Kysaiah Pickett 81 8 
Ed Langdon 79 9 Clayton Oliver 65 10 
Christian Salem 60
FULL TABLEDemonland Interviews


 Upcoming Events


Recommended Posts
Join the conversation
You can post now and register later. If you have an account, sign in now to post with your account.