


Stats File 2026 Season
Featured Replies
Featured Content
-
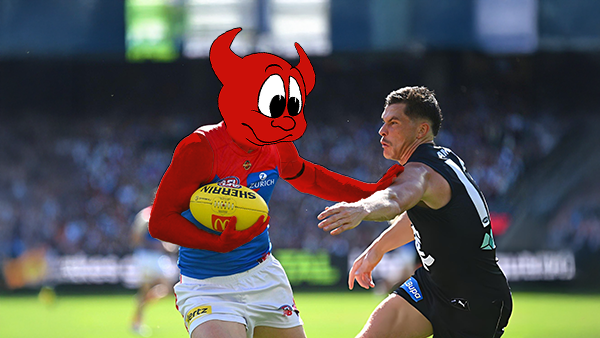
POSTGAME: Carlton
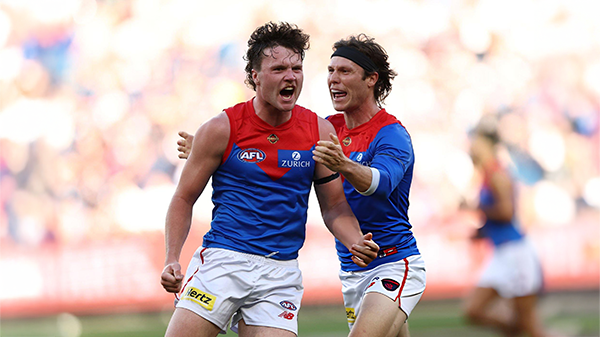
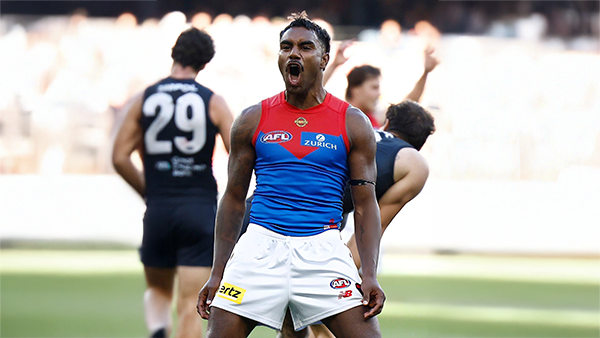
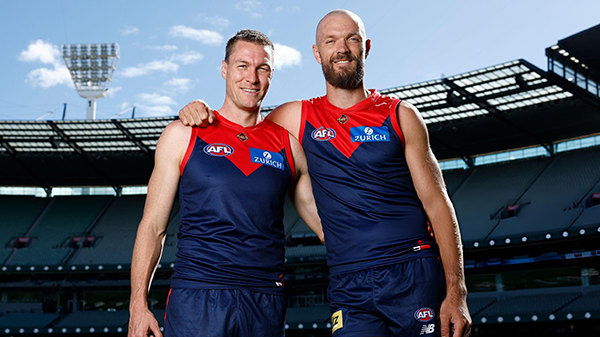
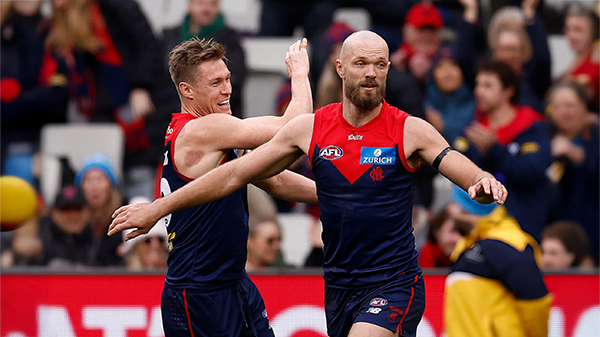
The Demons snatched Victory form the Jaws of Defeat as they clawed their way back from 43 points down to win by 23 points in Max Gawn and Tom McDonald's 250th matches at the MCG. Never in Doubt!!!-
-
- 292 replies
-
-
PODCAST: Carlton
The Demonland Podcast will air LIVE on TUESDAY, 31st March @ 8:00pm. Join Binman, George & I as we dissect the Dees miraculous 66 point turnaround win against the Blues at the G.- 22 replies
-
VOTES: Carlton
The Milestone Man Max Gawn is currently leading the Demonland Player of the Year Award from Jack Steele, Jacob van Rooyen & Christian Salem. Your votes please for the Demons come from way behind win against the Blues. 6, 5, 4, 3, 2, & 1.-
-
- 68 replies
-
-
GAMEDAY: Carlton
It’s Game Day and the Demons are back at the MCG for a big occasion, celebrating the 250-game milestones of Premiership pair Max Gawn and Tom McDonald, while rookie Paddy Cross gets his first taste of AFL football against the Blues. What are you hoping to see from the Dees today?-
- 585 replies
-
-
NON-MFC: Round 03
Round 3 of the 2026 AFL Premiership Season kicks off on tonight. Follow along and discuss all the big games not involving the Dees. Who are you tipping this week and what are the best results for the Demons?-
-
- 339 replies
-
-
PREVIEW: Carlton
Recent meetings between Melbourne and Carlton have developed a striking and somewhat familiar narrative, underscored by a series of closely contested encounters ultimately decided by narrow margins. The Blues have won out on each of the past four occasions:-- 2 replies


|

|

|

|
 |
 |
 |
 |
 |
 |
 |
 |
Join the conversation
You can post now and register later. If you have an account, sign in now to post with your account.