


Stats File - 2025 edition
Featured Replies
Featured Content
-
GAMEDAY: Carlton
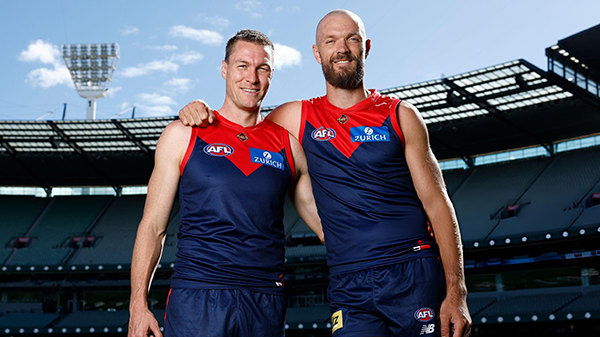
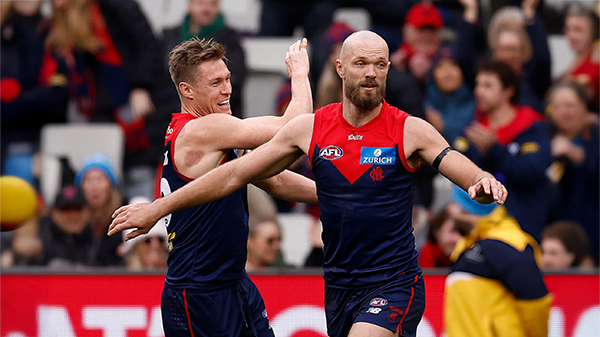
It’s Game Day and the Demons are back at the MCG for a big occasion, celebrating the 250-game milestones of Premiership pair Max Gawn and Tom McDonald, while rookie Paddy Cross gets his first taste of AFL football against the Blues. What are you hoping to see from the Dees today?- 0 replies
-
NON-MFC: Round 03
Round 3 of the 2026 AFL Premiership Season kicks off on tonight. Follow along and discuss all the big games not involving the Dees. Who are you tipping this week and what are the best results for the Demons?-
-
- 309 replies
-
-
PREVIEW: Carlton
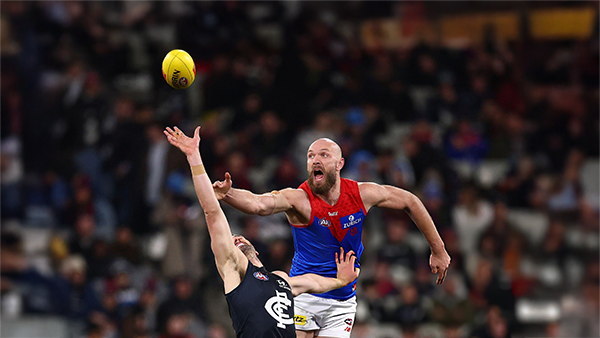
Recent meetings between Melbourne and Carlton have developed a striking and somewhat familiar narrative, underscored by a series of closely contested encounters ultimately decided by narrow margins. The Blues have won out on each of the past four occasions:-- 2 replies
-
PREGAME: Carlton
The Demons return to the MCG next week and will be looking to atone for a dismal performance in Perth as they take on the under the pump Blues. Who comes in and who goes out for our Round 3 match against the Carlton?-
-
- 480 replies
-
-
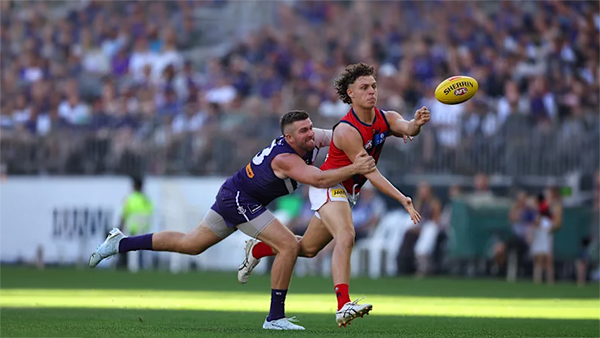
REPORT: Fremantle
Melbourne’s early surge of optimism came crashing back to reality in its clash with Fremantle at Optus Stadium on Saturday night. Just six days after unveiling its fun-filled, attack-minded style against the Saints, the Demons were met by a Dockers outfit determined to shut it down with a blend of speed, pressure, and physicality.- 0 replies
-
CASEY: Footscray
The Casey Demons faced a tough first up task taking on reigning VFL premiers Footscray at Mission Whitten Oval. The Bulldogs, who unfurled their premiership flag pre-game, had 15 AFL-listed players and their top VFL talent available, setting them up for their 15th consecutive win.- 5 replies


|

|

|

|
 |
 |
 |
 |
 |
 |
 |
 |
Join the conversation
You can post now and register later. If you have an account, sign in now to post with your account.