


Featured Replies
Featured Content
-
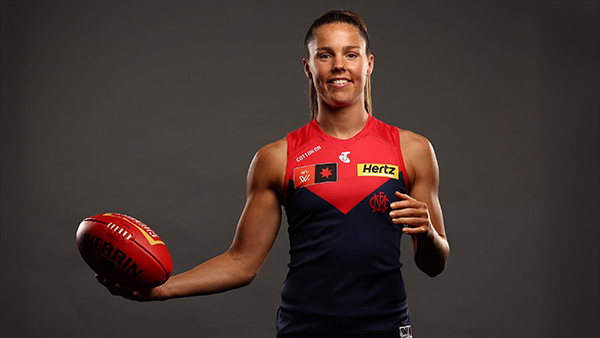
AFLW: 2025 Season Preview
Ten seasons. Eighteen teams. With the young talent pathway finally fully connected, Women’s Australian Rules football is building momentum and Season 2025 promises to be the best yet. In advance of Season 10, the AFL leadership has engaged in candid discussions with all clubs regarding strategies to boost attendance and expand fan bases. Concerningly, average attendances in 2024 were 2,660 fans per match, with the women’s game incurring an annual loss of approximately $50 million.-
-
- 0 replies
-
-
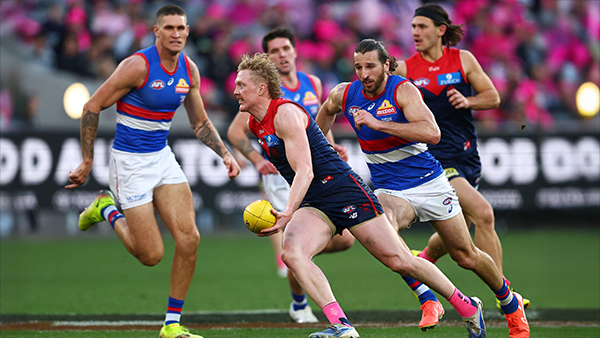
REPORT: Western Bulldogs
The next coach of the Melbourne Football Club faces the challenge of teaching his players how to win games against all comers. At times during this tumultuous season, that task has seemed daunting, made more so in light of the surprise news last week of the sacking of premiership coach Simon Goodwin. However, there were also some positive signs from yesterday’s match against the Western Bulldogs that the challenge may not be as difficult as one might think. The two sides presented a genuine football spectacle, featuring pulsating competitive play with eight lead changes throughout the afternoon, in a display befitting a finals match.The result could have gone either way and in the end, it came down to which team could produce the most desperate of acts to provide a winning result. It was the Bulldogs who had their season on the line that won out by a six point margin that fitted the game and the effort of both sides.-
-
- 0 replies
-
-
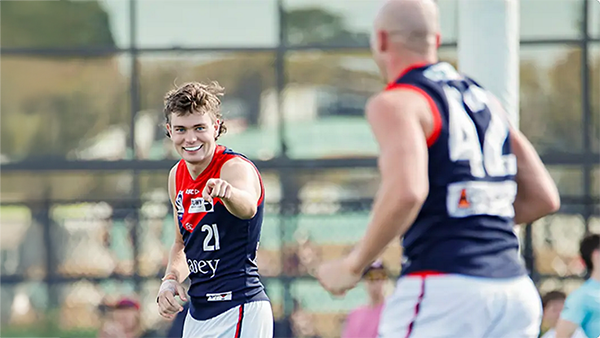
CASEY: Brisbane
The rain had been falling heavily in south east Queensland when the match began at Springfield, west of Brisbane. The teams exchanged early goals and then the Casey Demons proceeded like a house on fire in the penultimate game of the VFL season against a strong opponent in the Brisbane Lions. Sparked by strong play around the ground by seasoned players in Charlie Spargo and Jack Billings, a strong effort from Bailey Laurie and promising work from youngsters in Kynan Brown and Koltyn Tholstrup, the Demons with multiple goal kickers firing, raced to a 27 point lead late in the opening stanza. A highlight was a wonderful goal from Laurie who brilliantly sidestepped two opponents and kicked beautifully from 45 metres out.-
-
- 0 replies
-
-
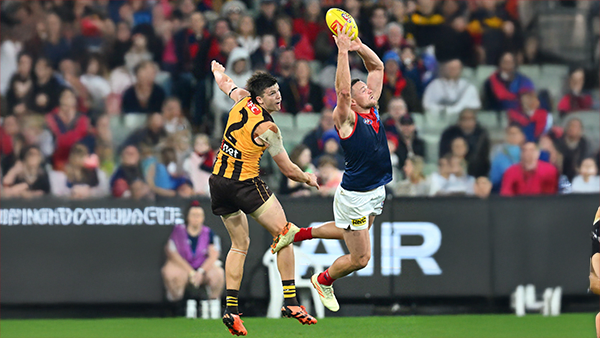
PREGAME: Hawthorn
The Demons return to the MCG this time as the visiting team where they get another opportunity to put a dent into a team's top 8 placing when they take on the Hawks on Saturday afternoon. Who comes in and who goes out?-
-
- 73 replies
-
-
PODCAST: Western Bulldogs
The Demonland Podcast will air LIVE on Monday, 11th August @ 8:00pm. Join Binman & I as we dissect the Dees disappointing loss to the Western Bulldogs.
Your questions and comments are a huge part of our podcast so please post anything you want to ask or say below and we'll give you a shout out on the show.
Listen LIVE: https://demonland.com/-
-
- 42 replies
-
-
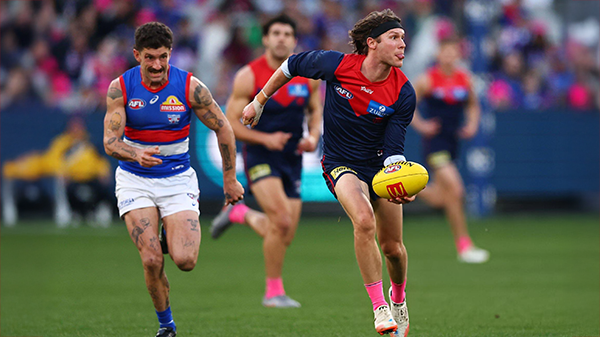
POSTGAME: Western Bulldogs
The Demons lacked some polish but showed a lot of heart and took it right up to the Bulldogs in an attempt to spoil their finals hopes ultimately going down by a goal at the MCG.-
-
- 337 replies
-


|

|

|

|
 |
 |
 |
 |
 |
 |
 |
 |
Join the conversation
You can post now and register later. If you have an account, sign in now to post with your account.