Everything posted by WheeloRatings
-
Brownlow Ladder 2022
- 2022 Brownlow Medal
They generally didn't have consistently dominant players, at least statistically. That, and the fact they didn't have dominant wins, the team as a whole may not poll as many votes as a 16 win team would typically poll. I have Crisp and N. Daicos polling the most for Collingwood.- 2022 Brownlow Medal
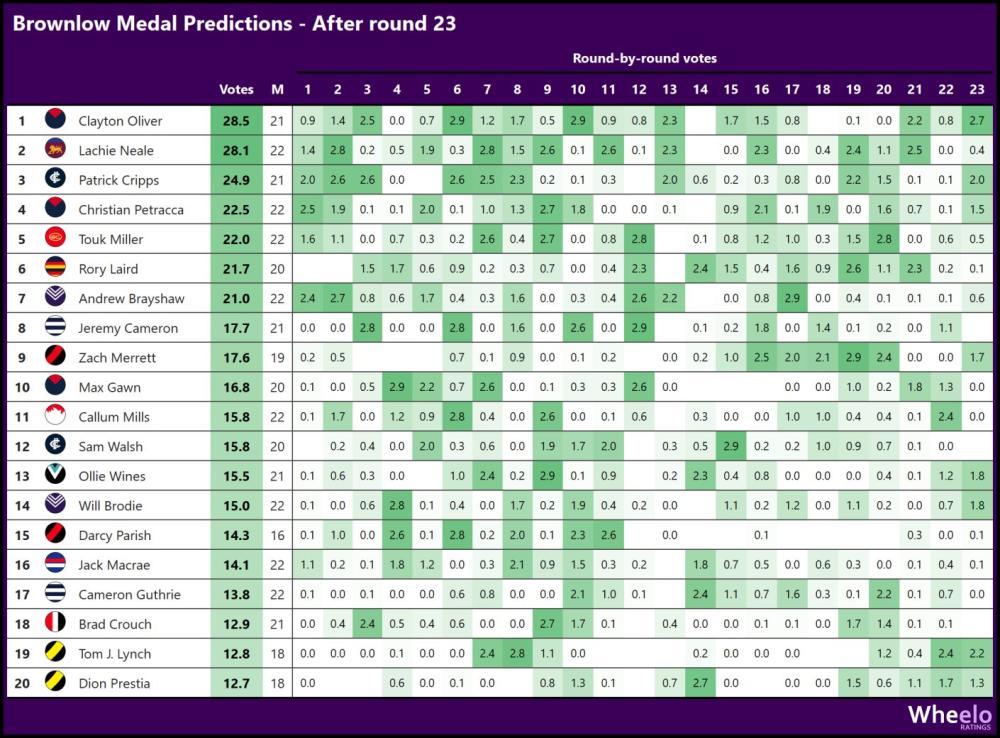
Here are my model's predictions based on in-game statistics. https://www.wheeloratings.com/afl_brownlow.html- Premiership Metrics - what do the last ten premiership teams have in common?
Haha I'm not taking that bet! Binman said he'll discuss it on the podcast and he's a far better analyst of the game than I am 😉- Premiership Metrics - what do the last ten premiership teams have in common?
Yes it is interesting - I'm not sure whether it reflects a true improvement in accuracy or it's a reflection of location of shots being taken.- Premiership Metrics - what do the last ten premiership teams have in common?
Yes there have been some changes in the overall competition averages, but also the distribution of values for particular stats across the 18 teams may be different this year with two particularly weak teams this season. Here are some of the notable changes (in AFL-wide team averages) from 2021 (including finals) to 2022 to date: Goals up from 11.5 to 12.1 Shots at goal up from 24.3 to 24.8 Accuracy up from 47.4% to 48.7% Inside 50s up from 51.4 to 52.3 Metres gained up from 5542 to 5814 Metres gained per disposal up from 15.2 to 16.2 Clangers up from 57.1 to 60.2 Hit-outs up from 34.4 to 35.7 (due to an increase in ruck contests from 85.4 to 89.4) Uncontested possessions down from 223.9 to 217.3 One-on-one contests down from 17.3 to 15.3 Marks down from 94.6 to 92.1 Contested marks down from 11.5 to 10.7 Marks inside forward 50 down from 11.5 to 11.1 Marks on lead down from 7.9 to 7.3 Play on % from kick-ins up from 82.8% to 85.3%- Premiership Metrics - what do the last ten premiership teams have in common?
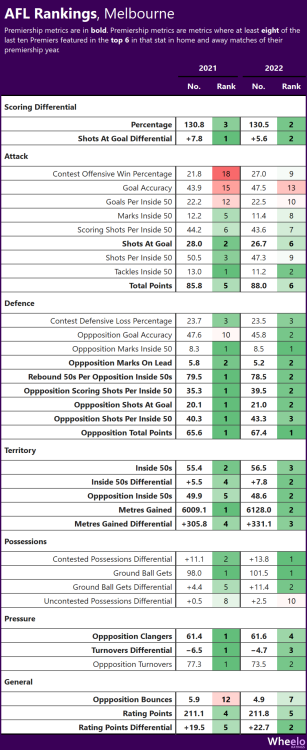
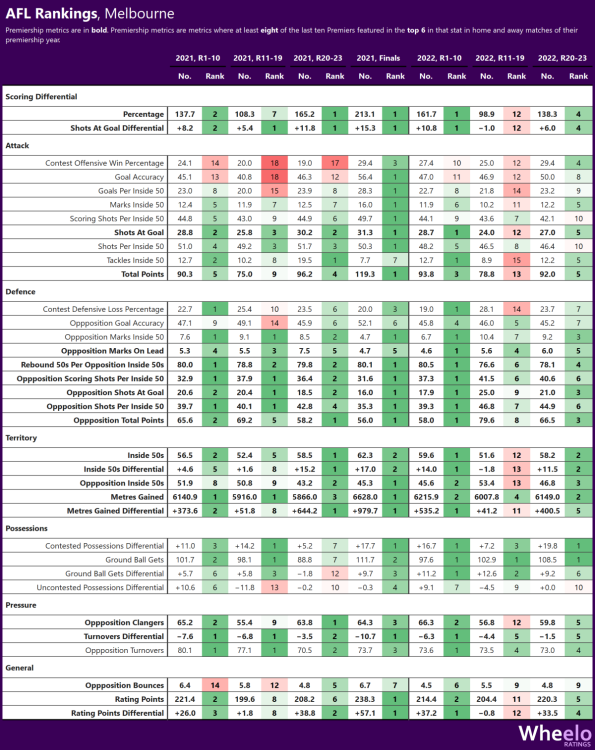
Just to add to my previous post, here is the summary for the past two home and away seasons for Melbourne.- Premiership Metrics - what do the last ten premiership teams have in common?
Thanks @binman I look forward to the discussion. I agree it wouldn't have much impact on the overall methodology.- Premiership Metrics - what do the last ten premiership teams have in common?
Thanks @Watson11 Yes that's definitely an issue. I guess the best you could do to minimise the effect of the uneven fixture is take the average of the double up matches so each team gets an average per opponent, then take an average across the 17 opponents.- Clayton Oliver now 2022 Brownlow favourite?
FWIW I have Clayton Oliver just ahead of Lachie Neale on my Brownlow Medal model predictions. It is only based on in-game statistics, not media/coaches votes so will be somewhat limited, but I think Oliver is definitely in with a shot. https://www.wheeloratings.com/afl_brownlow.html- Premiership Metrics - what do the last ten premiership teams have in common?
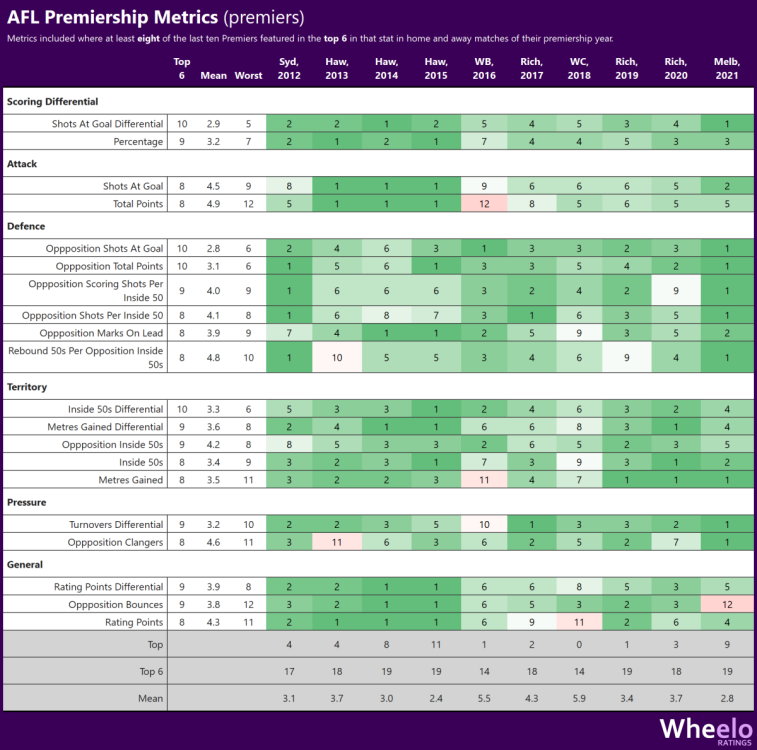
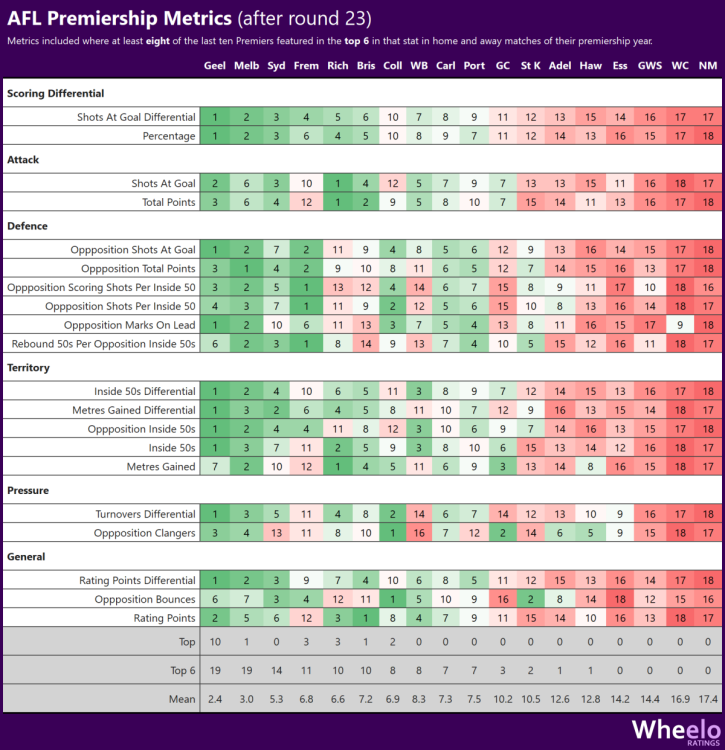
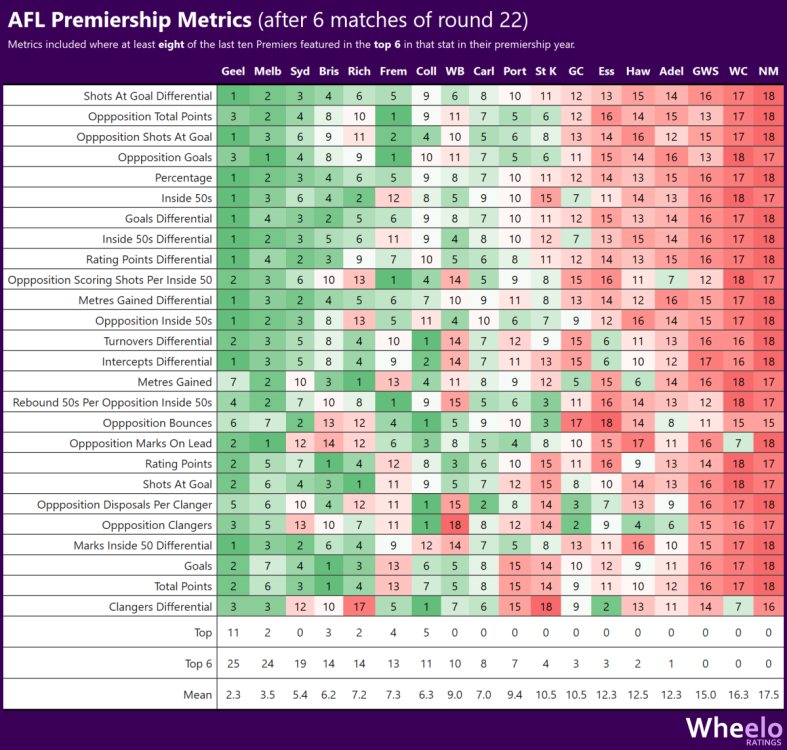
End of Home and Away Season Update Firstly, thanks @Demonland @binman @george_on_the_outer for briefly touching on this thread in last week's podcast. Here is an update to the Premiership Metrics following the end of the home and away season. I have updated the methodology to look at the past ten premiers in home and away matches only and removed some measures which were effectively duplicates. I have also grouped the metrics into categories to make the tables easier to read. With these updates, there are 20 statistical categories in which at least eight of the last ten premiers ranked in the top 6. Eight of the last ten premiers were ranked in the top 6 in at least 17 of these 20 categories (the Western Bulldogs in 2016 and West Coast in 2018 ranked in the top 6 in 14 categories). "Premiership Metrics" ranked in the top 6 in 2022 (out of 20) 19: Geelong 19: Melbourne 14: Sydney 11: Fremantle 10: Richmond 10: Brisbane 8: Collingwood 8: Western Bulldogs What are the Premiership Metrics? Where do teams ranks against these metrics in 2022? Melbourne Here are Melbourne's rankings for rounds 1-10, 11-19, 20-23 for both 2021 and 2022 and finals in 2021. In addition to the so-called "Premiership metrics" (in bold), I have included several other stats of interest. If anyone has any requests for inclusion of additional stats (from https://www.wheeloratings.com/afl_stats_team.html), let me know. Please note that Melbourne's comparatively harder fixture in the second half of this season compared to last season will have an impact on the rankings.- Premiership Metrics - what do the last ten premiership teams have in common?
Thanks @Hellish Inferno I will posting an update soon. I will also look at Melbourne's rankings for rounds 1-10, 11-19 and 20-23 for this season and last season, and finals last year.- Premiership Metrics - what do the last ten premiership teams have in common?
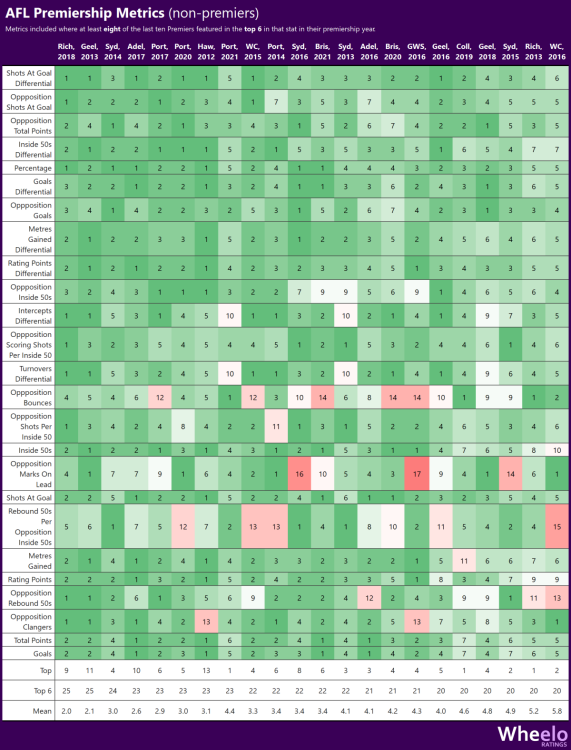
Thanks! I re-ran the analysis for just home and away matches and looked at teams that did not win the premiership, and dominating these metrics certainly doesn't guarantee a premiership. The updated H&A version has 25 metrics - Hawthorn 2012 were #1 in 13 metrics, Geelong 2013 were #1 in 11, Adelaide 2017 were #1 in 10. Also, Richmond 2018 and Geelong 2013 were top 6 in all 25.- Premiership Metrics - what do the last ten premiership teams have in common?
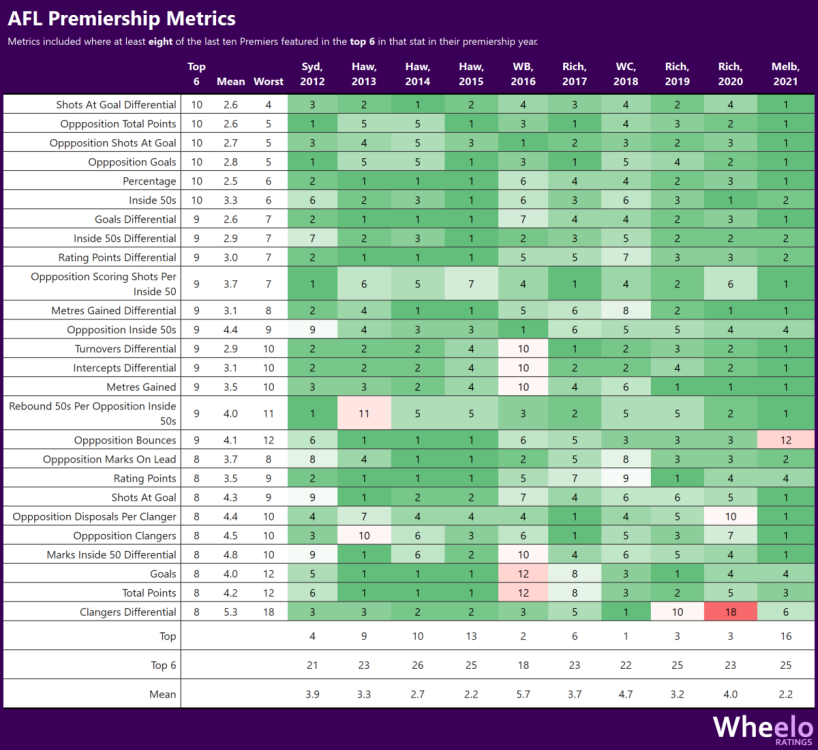
What do the last ten premiership teams have in common? They were all ranked in the top 6 in the following statistical categories in their premiership year: Shots at goal differential (all ranked top 4) Total points conceded Opposition shots at goal Opposition goals Percentage Inside 50s Following on from the thread H&A % as an indicator of team chances to win Finals, I decided to look at what stats (including percentage) recent premiership teams have in common using a somewhat simplistic methodology. I have analysed the ranks of the last ten premiership teams against a large number of statistical categories in their premiership year. There are 26 statistical categories in which at least eight of the last ten premiers ranked in the top 6. The list of the 26 categories are in the images at the end of this post. Nine of the last ten premiers were ranked in the top 6 in at least 21 of these 26 categories (the Western Bulldogs ranked in the top 6 in 18 categories in 2016). Melbourne ranked number 1 in 16 of these categories last year, more than any other premiership team in the last ten years. There are currently three standout teams this season for these "premiership metrics" - Geelong, Melbourne and Sydney. "Premiership Metrics" ranked in the top 6 in 2022 25: Geelong ⭐ 24: Melbourne ⭐ 19: Sydney ⭐ 14: Brisbane 14: Richmond 13: Fremantle 11: Collingwood 10: Western Bulldogs 8: Carlton What are the Premiership Metrics? Where do teams ranks against these metrics in 2022?- H&A % as an indicator of team chances to win Finals
Win Production Function: http://www.matterofstats.com/mafl-stats-journal/2011/5/22/win-production-functions-for-afl-teams-1897-to-2010.html- H&A % as an indicator of team chances to win Finals
Matter of Stats posts an AFL Team Dashboard after each round which includes their "WPF Expected Wins" (last column in first image below) rank and the "Expected Win %" (far right of middle table of second graphic below). Melbourne 3rd, Collingwood 9th. http://www.matterofstats.com/mafl-team-dashboards/matterofstats-2022-team-dashboard-for-round-21 Matter of Stats formula: X = 0.164 x (SS For - SS Against) + 6.18 x (Own Conversion - Opponent Conversion) Expected(Wins) = exp(X)/(1+exp(X)) While this isn't the Pythagorean expectation formula, in Matter of Stats' Pythagorean expectation post he indicated that "we find that the optimal value of k oscillates around 2 from about the late 1930s onwards". I haven't tried applying the Pythagorean expectation model myself.- Who's helping to fix our goal kicking woes?
Ha, that had crossed my mind! The name combines my surname (Whelan) and elo ratings - and I was hoping people wouldn't put the emphasis on the 'O'! 😂- Who's helping to fix our goal kicking woes?
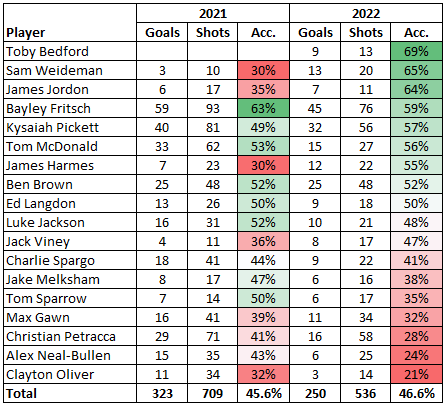
His set shot accuracy (20%) is actually worse than his accuracy in general play (31%). This was posted on Twitter recently:- Who's helping to fix our goal kicking woes?
Yes, here are all our players with 10+ shots this year and a comparison to last year, noting that our overall accuracy is higher than last year.- The Run Home
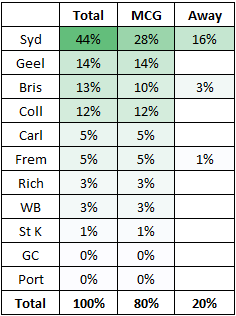
Here's an update of my simulations following round 20, with Melbourne most likely playing Sydney in the first week of finals. Sydney has a relatively easier draw than Collingwood so will quite possibly finish higher than Collingwood. Likely opponent in first week of finals, noting that I have all Victorian matches at the MCG- OUR USE OF THE SUB RULE
@crow_data_sci posted some interesting stats on Twitter regarding the use of the medi-sub. Port Adelaide has had the most players subbed off and play the next week in both of the last two years (5 in 2021, 4 in 2022). Melbourne and Sydney have had no player subbed off and play the next week at all across the last two seasons. Source:- The Run Home
I have a model that rates teams based on past results and the current team ratings are here: https://www.wheeloratings.com/afl_ratings.html The model estimates match win probabilities based on the current team ratings and venue advantage. For example, my model rates Melbourne a 48.5% chance of winning this week. Each week, I simulate the remainder of the season 50,000 times based on those win probabilities. So roughly 48.5% of the simulations will result in a Melbourne win against Fremantle and 51.5% will result in a Fremantle win (although a proportion of matches will end in a draw too). I do simulate match margins too based on a normal distribution with a mean of the expected margin so it does allow a team with easier matches to increase their percentage, although Sydney does have some ground to make up. My model doesn't rate Collingwood that highly given they've had so many wins by small margins, so they could potentially outperform my model's expectations and therefore somewhat reduce Melbourne's chances of finishing top 4 in the two win scenario.- The Run Home
I agree they shouldn't be taken lightly and I won't be confident at all when we play them. They are 8-1 in games decided by 12 points or less, which is an amazing record (don't get me wrong). They have done very well to win all those close games but there's an element of luck in winning close games. They gave away a free kick to Essendon in front of goal inside the last minute. If they kick that goal, Collingwood lose and they're 7th. I don't want to take anything away from them subsequently going coast-to-coast and Elliott kicking an incredible goal after the siren, but they weren't in control of the Essendon shot at goal. I'm not saying they're not a good side, I just think that 13-5 and 4th flatters them a little bit considering their % is only 106.- The Run Home
Yes, realistically we should start favourites against Collingwood and Carlton as well. Collingwood has won a lot of close games so their ladder position probably flatters them somewhat.- The Run Home
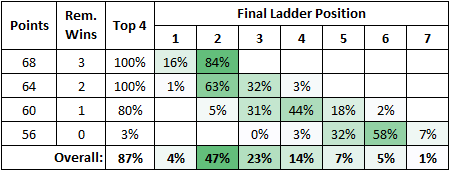
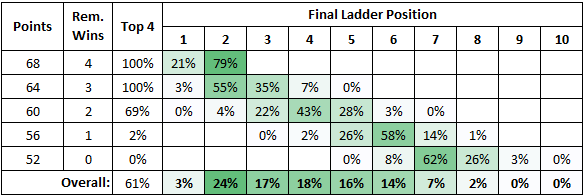
Based on my simulations (50,000 simulations of the remainder of the season), this is what I get for Melbourne's probability of finishing in each ladder position for a certain number of wins over the last four rounds. - 2022 Brownlow Medal


