Discussion on recent allegations about the use of illicit drugs in football is forbidden
Search the Community
Showing results for tags 'stats'.
Found 7 results
-
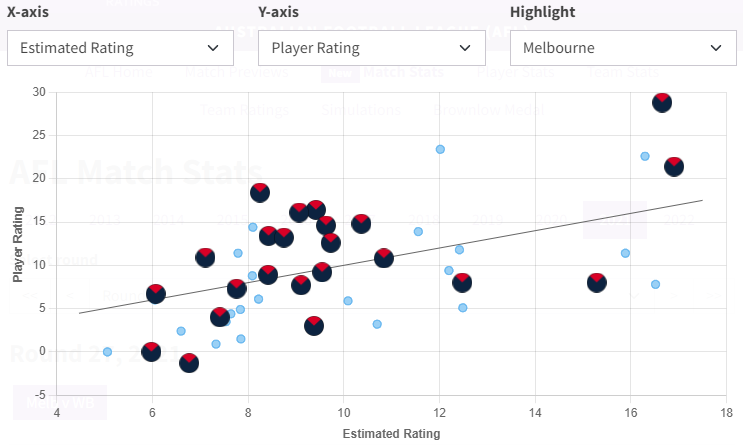
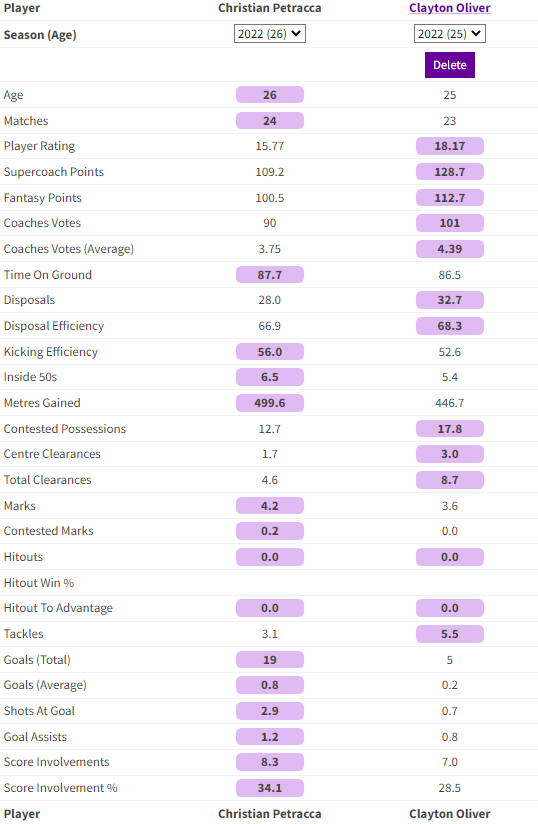
For those who aren't aware, I manage a website Wheelo Ratings that has a range of AFL stats available. I have added quite a bit of functionality since last season, including player and team stats back to 2012, individual player profiles, match stats, and interactive charts. Here are some of the key pages and features. I will probably add new functionality as the season progresses but if anyone has any suggested features, let me know. Player Stats (2012-) https://www.wheeloratings.com/afl_stats.html Key features: View all statistical categories or save your favourites. Includes 60+ stats, including AFL player ratings, coaches votes, centre bounce attendances, one-on-one contests, ruck contests and all your usual stats. Filter by team, position, etc. Interactive scatter plot, with the option of highlighting players from a particular team. Download data as csv file. Team Stats (2012-) https://www.wheeloratings.com/afl_stats_team.html Key features: Team averages, opposition averages, differential. Interactive scatter plot. Download data as csv file. Match Stats (2012-) https://www.wheeloratings.com/afl_match_stats.html Key features: View specific match or all matches for a particular round. Interactive scatter plot. Download data as csv file. Grand Final 2021: https://www.wheeloratings.com/afl_match_stats.html?ID=20212701 Player Profiles (players who have played AFL since 2012) https://www.wheeloratings.com/afl_player_profile.html Key features: View stats for each season, including overall career. Trend chart by season. Compare a player with up to four other players. Search for players or navigate from links on player stats and other relevant pages. Clayton Oliver: https://www.wheeloratings.com/afl_player_profile.html?ID=2db9dd Christian Petracca: https://www.wheeloratings.com/afl_player_profile.html?ID=231162 Max Gawn: https://www.wheeloratings.com/afl_player_profile.html?ID=22f360 Jack Viney: https://www.wheeloratings.com/afl_player_profile.html?ID=22f8be Steven May: https://www.wheeloratings.com/afl_player_profile.html?ID=22ce7d Bayley Fritsch: https://www.wheeloratings.com/afl_player_profile.html?ID=14074de Angus Brayshaw: https://www.wheeloratings.com/afl_player_profile.html?ID=2311a7 Team Annual Summary (1897-) https://www.wheeloratings.com/afl_annual_summary.html Key features: View win/loss records and team ratings for all seasons in VFL/AFL history. Interactive scatter plot.

-
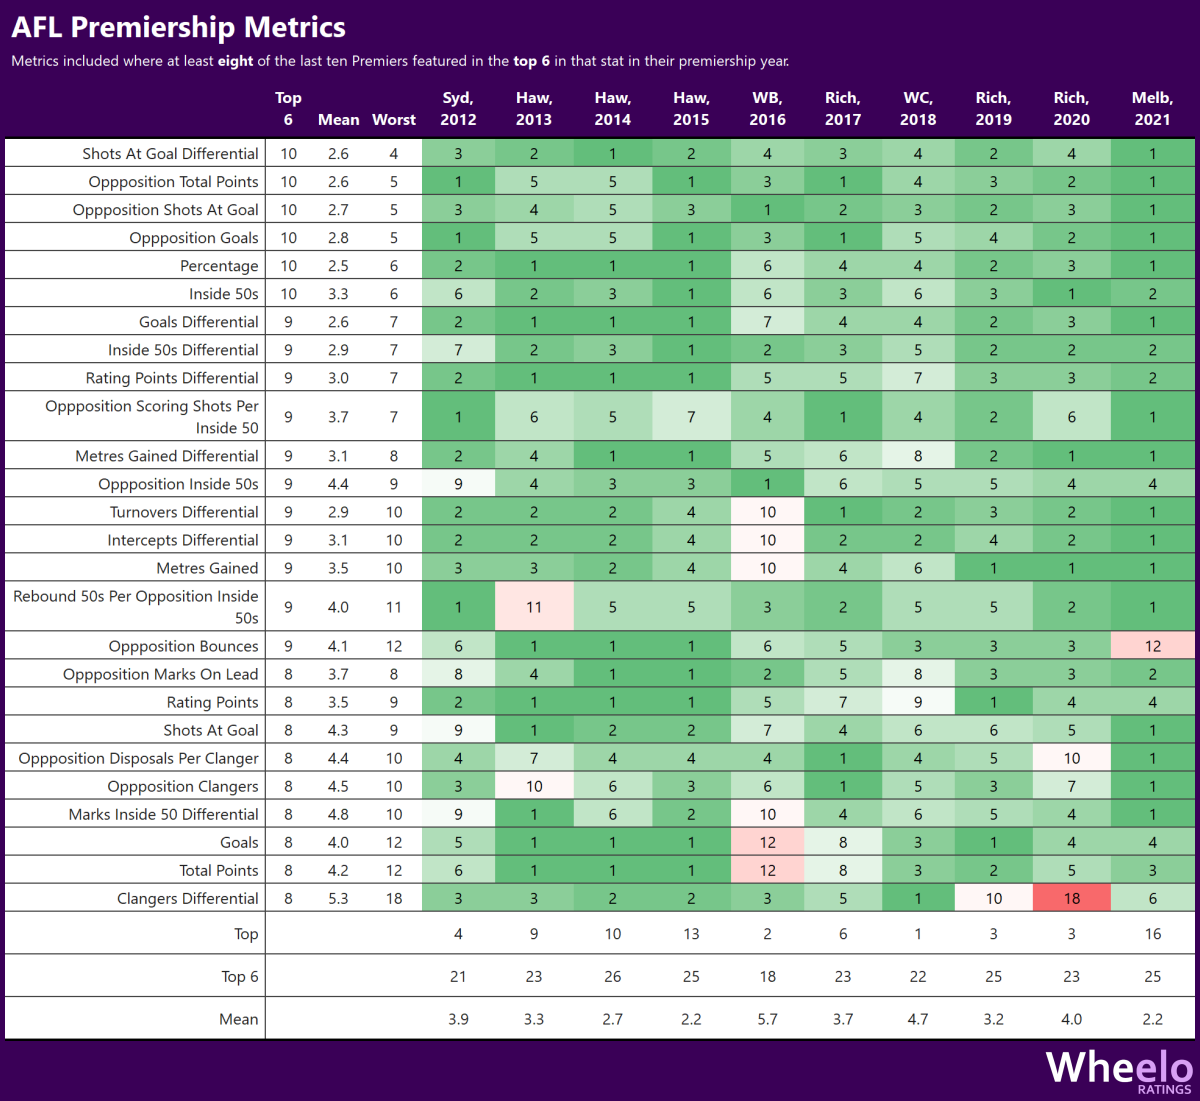
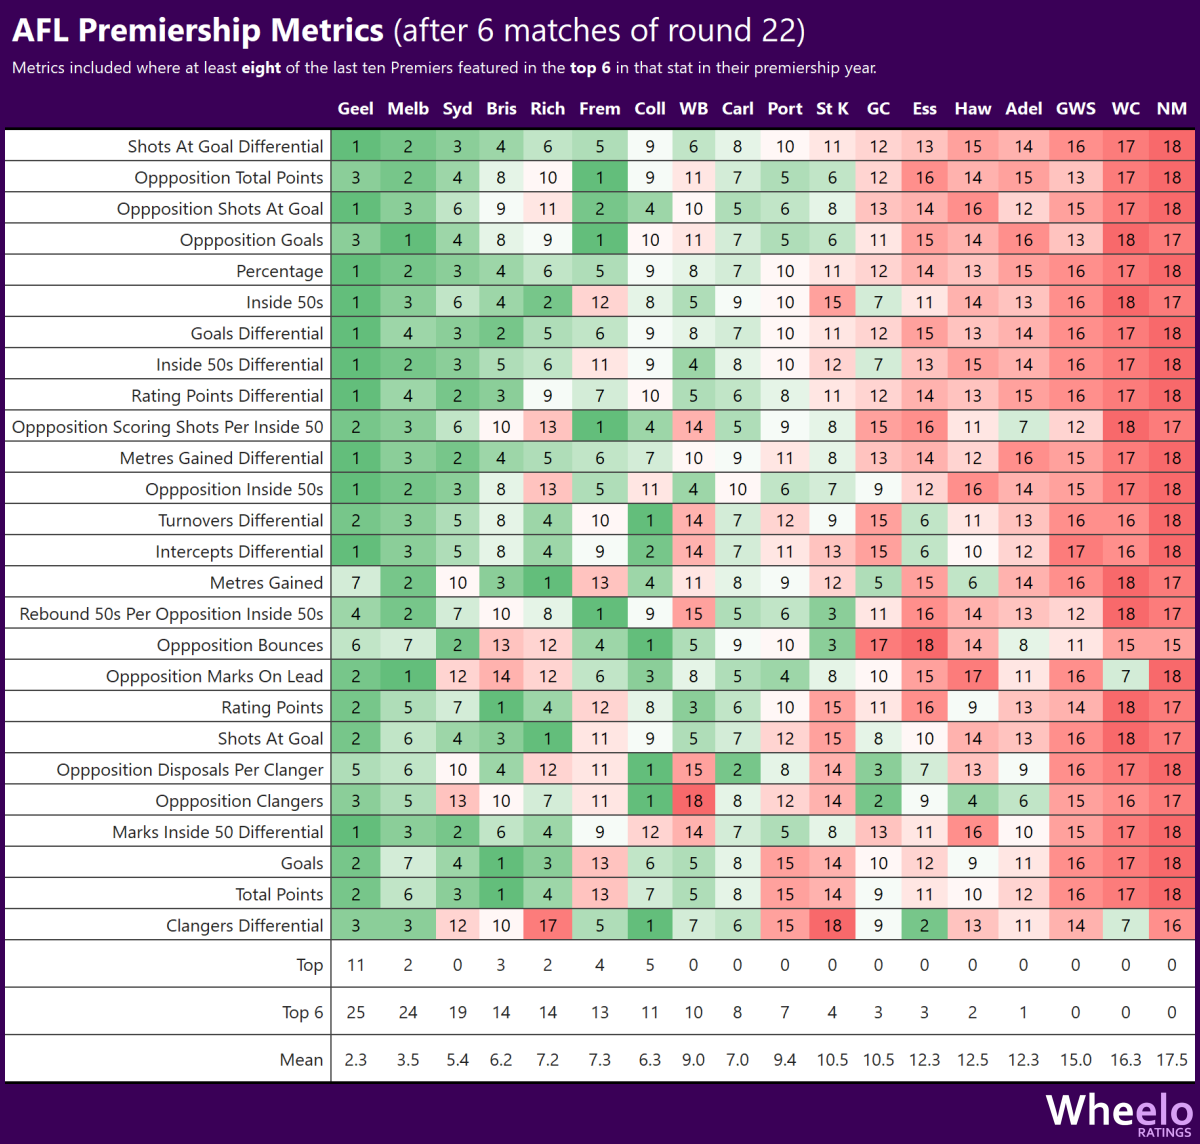
 What do the last ten premiership teams have in common? They were all ranked in the top 6 in the following statistical categories in their premiership year: Shots at goal differential (all ranked top 4) Total points conceded Opposition shots at goal Opposition goals Percentage Inside 50s Following on from the thread H&A % as an indicator of team chances to win Finals, I decided to look at what stats (including percentage) recent premiership teams have in common using a somewhat simplistic methodology. I have analysed the ranks of the last ten premiership teams against a large number of statistical categories in their premiership year. There are 26 statistical categories in which at least eight of the last ten premiers ranked in the top 6. The list of the 26 categories are in the images at the end of this post. Nine of the last ten premiers were ranked in the top 6 in at least 21 of these 26 categories (the Western Bulldogs ranked in the top 6 in 18 categories in 2016). Melbourne ranked number 1 in 16 of these categories last year, more than any other premiership team in the last ten years. There are currently three standout teams this season for these "premiership metrics" - Geelong, Melbourne and Sydney. "Premiership Metrics" ranked in the top 6 in 2022 25: Geelong ⭐ 24: Melbourne ⭐ 19: Sydney ⭐ 14: Brisbane 14: Richmond 13: Fremantle 11: Collingwood 10: Western Bulldogs 8: Carlton What are the Premiership Metrics? Where do teams ranks against these metrics in 2022?
-
I am reliably advised that St Kilda's Brad Hill and Brad Crouch have broken the AFL record for most disposals by players called Brad for a team in an individual game - they both had 26 disposals last weekend combining for 52 in total. This breaks the previous record of 50 held by our Brad Green (32) and Brad Miller (18) in round 13 2004. As additional useless information, the record by two players with the same name is held by Collingwood's Tony Shaw (50) and Tony Francis (30) who combined for 80 disposals in round 5 1991. And, St Kilda holds the record for most disposals by one first name for a team in the same game with 151 held by six Jacks in Rd 16 2017 being Billings (19), Lonie (18), Newnes (25), Sinclair (28), Steele (28) and Steven (33). I don't know about you, but this is the essential content I come to Demonland for.
- 13 replies
-
- 13
-

-

-
- brad green
- stats
- (and 1 more)
-
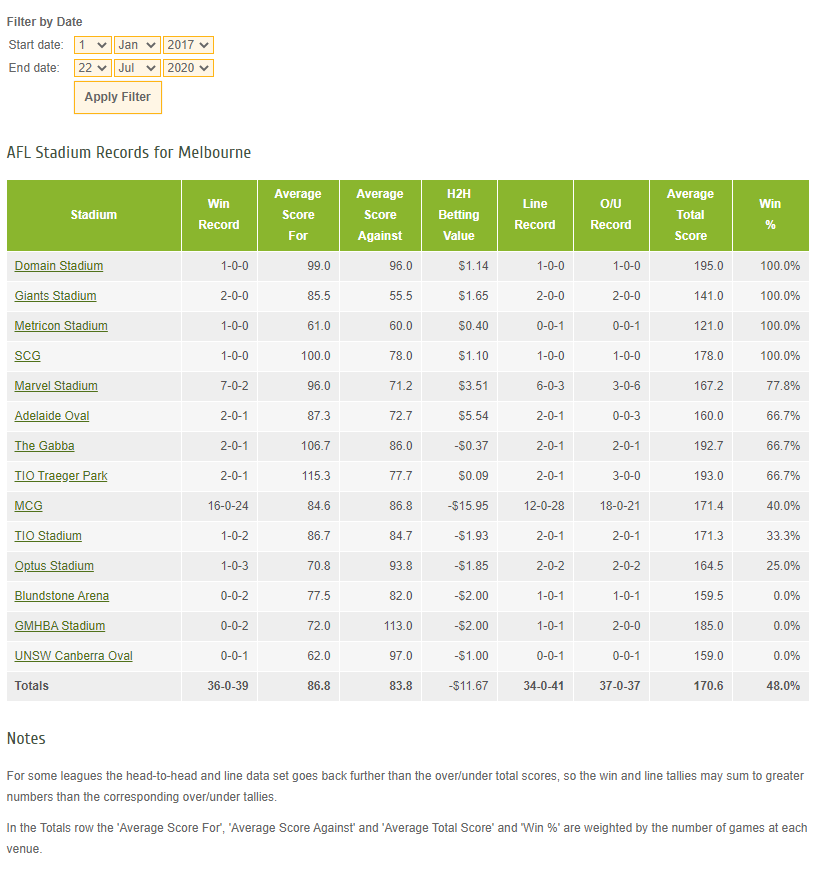
Ok so keeping some of the positive vibes going, I thought it might be interesting to highlight another positive with this crazy covid season - not playing on the MCG! (apart from not being able to see us live!) It's not that we can't win there... but surely it's been harder since Goody took over (eg we go at 40% win at the MCG under Goody but were at 46.2% under Roos in his last year in 2017). Even in 2018 we only had a win percentage at the MCG of 53.8% but were much higher elsewhere. I suspect this is mostly due to game style / how we set up our zone etc. However, our record at most other grounds is pretty good - particularly the skinny grounds. So if we're staying away from the MCG (and ideally Optus in Perth) then I think this surely can only help us. The stats below are interesting and even more so when you think of some of the matches there. Eg we have a poor record in Geelong but when we played them in 2018 we lost by a kick. Similarly when we played Port in 2018 we were absolutely robbed by the umpires but played well and were unlucky to lose. Similiarly we're usually in the matches agaisnt North in Tassie despite not beating them there under Goody. Our worst performances (2019 aside) have come at the MCG, Canberra and Optus which are all bigger grounds. Probably good not too be playing too much at the Gabba for the moment as well as it is bigger than say Metricon. Managed to find this via the aussportstipping site if someone else wants to play around with the filters
- 16 replies
-
- 3
-
-

-
- afl grounds
- afl dimensions
- (and 1 more)
-
There is always going to be noise this early in the season but I thought I would throw these out there to try and see whether there is improvement in the up and down start to the season: Contested Possession We are down 4.2 a game and that has meant going from 6th in 2016 to 12th at the moment. Uncontested Possessions The new kings of UPs is Goodwin; we are racking up the most at 272 a game, up over 30 a game from last year (when we were 4th). Clearances Down 1.5 a game and that means we slip from 5th in 2016 to 12th. Inside 50s Up slightly but still 7th in the league - same as 2016. Scoring Shots Currently 4th in the league, up from 12th last year and really quite promising. We have had an extra 3.5 shots at goal this year. As an aside - Sydney has had 7.6 less shots at goal this year... Summary To much finessin' with the ball is evident from those numbers of UPs but we are steady in I50s and up in shots at goal. Lot of noise at this point, but it might mean - in an even season - that we create enough to beat enough teams to get into September. I will say - dropping 4 CPs a game is quite a bit of a drop. I would worry if that doesn't correct.
-
Ok, so those that have been here a while know I don't mind looking at the stats and that I also trail off when the stats start to get too depressing to continue capturing but here we go... I think Clearances, Inside 50s, Uncontested Possies, Contested Possies, Score, and Quarters Won are tried and tested measurements of any team at any level. Below is a table that shows our average in all those categories from the last 3 years and also the differential between us and our opponent. For example, in the Clearances column we can see that we averaged 37.6 clearances last year - an increase of 3.3 - but our differential only went down 0.3 so our opponents averaged 3 more clearances than they did in 2014. CL I50 Ups CPs Score QW 2015 Differential -3.1 -9.0 -12.0 -0.9 -21.4 35 2015 Melbourne Ave 37.6 44.5 203.5 135.2 71.5 2014 Differential -4.8 -11.6 -6.5 -1.5 -28.1 30 2014 Melbourne Ave 34.3 40.5 218.4 130.2 60.7 2013 Differential -9.7 -18.0 -56.7 -23.5 -56.2 20 2013 Melbourne Ave 32.5 40.0 191.7 123.7 66.1 I will do this tracking for 2016 and for your benefit here is the NAB Challenge:We are tracking well (still mediocre but better) in Clearances, Inside 50s, Contested Possies, and Score with a drop off in uncontested possies. However, when I took out the 4 games we had against Freo, Syd, and Haw we tracked 11 UPs better off (and yes, I took out the commensurate games against those teams from 2014 to measure against). NAB Ch. Opp Diff 5.3 9.3 27.3 15.0 18.3 7 NAB Ch. Melb Ave 37.3 50.3 210.0 135.3 91.3 All categories are either holding steady at good levels or have improved out of sight. Too bad it doesn't mean anything... Let's hope we see some similar numbers when the proper stuff starts on Saturday.
-
Now I don't consider my self to be old enough to be considered wise. But. I'm getting very sceptical of how complicated things have become in AFL. Pages and pages of stats sheets. Pre game, 1/4 time, half time, 3/4 time, after the game. And full of every conceivable stat you could think of. Metres gained, contested possessions in the forward 50, hitouts in the first half of a 1/4 compared to the second half of a 1/4, 1%ers on Sundays with a NW wind compared to on a Saturday with a SW wind. FMD how complicated is it? I can't wait for a coach to ditch this ridiculous over-analysis crap, screw up the stats sheet and start telling the players how it is. First to the ball, run past with a voice, kick it to the boundary if there's nobody in the clear, hit a target if they're open, move the ball forward, tackle hard, play in front in the wet, be accountable to your man on a turnover. Why does it have to be so scrutinised all the time. Coaches, and players, don't need damning stats to tell them who's played well. If they don't know that walking off the ground then there is something seriously wrong. And drafting. OMG can we get rid of the absurd psychoanalysis rubbish? They didn't do this 20 or even 10 years ago but good players kept getting drafted back then. Is there a higher success rate for drafted players since this rubbish came in? I wouldn't think so. Forget the draft combine and testing. Go watch the kids play. Surely you could get more out of watching a draftee play a full game or two than you can from looking at their times running through laser timers and touching vertical jump tabs. It's sports science gone mad. Can he play? Is he hard at the ball? Does he have game pace? (Not this Jack Watts sprint testing bollocks. Actual 'game' pace). Can he hold a contested overhead mark? Does he chase on a turnover? I'm just so sick of the micro-analysis in this sport. We're not trying to find a gifted athlete to shave 0.001 seconds off of a 100m sprinting record. It's football. It's a team game and the same old skills and effort win games now like they did way back when MFC were a good team. Stats lie.