

binman
-
Posts
15,057 -
Joined
-
Last visited
-
Days Won
96
Content Type
Profiles
Forums
Events
Store
Posts posted by binman
-
-
1 minute ago, Roost it far said:
Binman put me on igmore.....he's loving the peace and quiet :)
To tell the truth, i actually didn't in the end.
I put you in my dl purgatory level - read the posts, no emojis and no quoting.
I have enjoyed your posting and appreciated how balanced you were during the annual bye phase form drop off
You're officially out of purgatory now that I have quoted you.
-
 5
5
-
 7
7
-
 1
1
-
-
Just now, Binmans PA said:
Exactly how I would have gone and how I thought we'd go.
Petty, JVR and Disco 10 minutes each per quarter.
Happy with this and excited to see how we go with it.
I can't say I thought we’d roll with no ruck, but 100% see the logic.
Disco took as many centre bounces as roo last week, so as you say those two and Petty can share ruck duties.
It's going to be a bit slippery, so that negates draper a bit. But also means less scoring and therefore less centre square bounces.
We can go to work on sharking draper exactly the same way opponents do to maxy.
And most of all, neither verell or the fella whose name I know will misspell and face the wrath of the pedants deserve a call up on form.
Fullers has been underwhelming and if he was selected would likely offer not much more than running with petts, roo and disco.
And verell, who I have a lot of time for and think will make it, is not ready yet. Picking him won't give us much and might be unhelpful for his development.
And if either verell or fullers was picked disco probably comes out.
There is an opportunity cost factor there, and goody has said he wants the three amigos in the team.
-
9
-
2
-
 1
1
-
-
I guess selection this week shuts down the goody is too predictable thread
-
4
-
11
-
-
1 hour ago, middleagedemon said:
Please put me on ignore for you and everyone else!
A genuine question.
WCW's posts appear to really trigger and/or upset you.
Why don't you put HER on ignore.?
-
5
-
-
6 hours ago, Whispering_Jack said:
The injury curse has hit yet another Demon.
Alex de Minaur has pulled out of Wimbledon prior to his quarter-final against Novak Djokovic due to a hip injury.
God our club is hopeless.
-
16
-
-
22 hours ago, deejammin' said:
Except this week when Harris Andrews did the exact same thing against Adelaide in the third quarter and a throw in was called.
The commentators even called it “Neale-Bullen like” when describing their shock it wasn’t called.
FWIW I think the May non called clear mark on the wing and Ed Langdons clear HTB tackle in the backline contributed more to us losing the game than ANB’s call. They’d already drawn even by then whereas the previous two calls happened when we were ahead.
I think the nibbla decision was right.
And to be honest I wish more umpires had the fortitude to make decisions at such a critical moments.
The umpires job is to pay frees that are there regardless of the ramifications or point in the match
Too many umpires take the easy way out and avoid making a decision at all near the end of close games. The whole 'they've put the whistle away' palaver is a joke.
So the media should be pumping him up.
But my frustration is how inconsistent the umpiring is from game to game and within matches.
On the former, tracc getting basically dragged to the ground in the dying seconds in the game against the blues is an example that comes to mind. Crystal clear free completey let go.
And on the latter, in the lions game there were several non decisions we should have got in the last quarter that cost us dearly as the free paid against nibbla.
The AFL is treating fans as a joke. We deserve more. Stop wasting money on stupid things like tracking micro chips in footies and pour it into improving the standard of umpiring.
-
6
-
-
36 minutes ago, IRW said:
100 games for just over 100 goals and one speccy.
His pressure acts are at least 50% running after the full back kicking in which is predictable pressure.
Memorable 1% ers are the block that allowed Tracs" Daicos" goal in the grandfinal ..that was elite 1% even if it was about the only thing he did on the day
I'll never understand what motivates someone to go to the bother of trolling people on a footy forum.
Most aberrant behaviour serves some sort of self protective purpose, so i hope you are ok.
Be that as it may, better for my wellbeing if I put you ignore.
See ya.
-
18
-
8
-
-
1 minute ago, Dr. Gonzo said:
On the other hand Gawn often wins ruck duels but we fail to win the clearance.
I think JVR competes well, especially in around the ground contests.
Agree.
But he didn't have his best day yesterday in the centre square contests.
-
3
-
-
28 minutes ago, chook fowler said:
If not Fullerton now, when?
-
1
-
 1
1
-
2
-
1
-
-
1 hour ago, WheeloRatings said:
I use two models for predicting results - one based purely on the teams and the other which takes into account the players playing in the match (and uses the players' predicted ratings you're asking about).
Here are the overall results between 2013 and now (the period that the player model is available):
Mean absolute margin error:
Standard model: 27.0 points
Player model: 26.3 points
(The average match margin was 32.8 points)% of tips correct
Standard model: 69.5%
Player model: 70.4%Squiggle aggregates a range of AFL models, including "Punters" which is an aggregate of odds from a number of betting agencies. My model's average margin error the last few seasons (since my model has been on Squiggle) has been ranked quite high on the Squiggle leaderboard and quite close to the punters' performance.
---
You are correct, the player ratings on my site are the Champion Data player ratings. The predicted ratings are a weighted average of a player's rating in past matches, weighted towards more recent matches and more recent seasons. It is limited to a maximum of a player's last 75 matches and 4 seasons, but more recent matches are weighted much higher.
I also take into account time on ground in past matches to ensure that a player who was sub or injured isn't punished unfairly for their lower rating in that match. The predicted rating is reduced for the named sub given they'll most likely play less than half the match. For example, Woewodin's predicted rating was 6.2 last week but 2.8 this week.
---
Hopefully the above helps!
70% is impressive. Interesting that both models are so close.
-
1
-
-
1 hour ago, Neil Crompton said:
Binny, do you know what those roles are? If yes, could you please explain, as it’s not so obvious to me. Also, is he “succeeding” in those roles, and could you suggest someone else who might play those roles instead - ie why Sparrow? Ta.
Is this a genuine question froggy?
I ask because it feels a bit like a gotcha, set up question.
-
1
-
-
4 hours ago, DistrACTION Jackson said:
van Rooyen is incredible... Schwarz saying the other day we should trade him for Max King!🤣
Will win Colemans in his career which is something Melbourne hasn't had many of!
He said what?
Was it the first of April?
-
3
-
-
3 hours ago, Gawndy the Great said:
Sparrow goes ok both ways too. Definitely a hard worker, clearly playing a defensive role in the team
Yep.
I have seen some posts calling for Sparrow to be dropped.
I think what his critics perhaps don't factor in is that he is given specific roles.
And far from goody playing favourites he's a best 22 lock because he does the jobs goody asks him to do.
-
10
-
1
-
 2
2
-
-
32 minutes ago, WheeloRatings said:
Thanks binman.
The team ratings (from here) are intended to measure how many points each team is above/below average at any point in time. The ratings update each week based on whether the team performs¹ above or below expectation².
- Expected performance in a given match is based on the two teams' ratings and a venue advantage.
- Actual performance in a given match is based on a weighted average of the team's actual score and the score they would have kicked if they kicked at the AFL average, to lessen the effect of really accurate or inaccurate kicking. I don't use expected scores in the model as I only have this data since 2021 (my team ratings are calculated for every round since 1897), but it is kind of a rough proxy for expected scores.
For example, a team's attacking rating will go up if their adjusted score is higher than expected, and their opponent's defensive rating will go down by the same amount. While it may throw up some strange results (Sydney's rating actually went up yesterday despite losing to St Kilda, which was because Sydney scored 27 times to 19), it has been optimised for predicting match results.
The model is somewhat based on the Matter Of Stats MoSHBODS model described here if you want some light reading (although some of the specifics in this model do differ from mine):
https://www.matterofstats.com/mafl-stats-journal/2017/1/5/team-rating-revisited-a-rival-for-mossbodsBrilliant, thanks wheelo.
My interest in stats and data is really about the story they tell, particularly when triangulated.
I'm a Luddite when it comes to the mathematical aspect, but if you don't understand how they are calculated it's impossible to know what story they tell.
What does the data say about your strike rate for accurately predicting results?
Another q - am I right to assume the player ratings you use are the champion data ratings (I might have asked you that before, apologies if I have).
And how do determine the predicted ratings?
-
1
-
6 hours ago, WheeloRatings said:
Melbourne v West Coast (Round 17, 2024)
https://www.wheeloratings.com/afl_match_stats.html?ID=20241706
Key Team Stats
Stats highlighted purple were won by Melbourne.
Stat For Against Diff Disposal Efficiency 73.6 72.9 +0.7 Kicking Efficiency 73.8 68.0 +5.8 Metres Gained 6149 5037 +1112 Inside 50s 49 49 +0 Shots At Goal 28 20 +8 Shots Per Inside 50 57.1 40.8 +16.3 Contested Possessions 129 104 +25 Ground Ball Gets 88 68 +20 Intercepts 64 54 +10 Intercept Marks 15 20 -5 Centre Clearances 8 18 -10 Stoppage Clearances 22 17 +5 Contested Marks 14 10 +4 Marks Inside 50 21 15 +6 Hitouts 28 34 -6 Hitouts To Advantage 10 12 -2 Tackles 56 54 +2 Tackles Inside 50 6 19 -13 Def One On One Loss % 20.0 33.3 -13.3 Contested Possessions
For Against Diff Melbourne's Defensive 50 Hard Ball Get 6 4 +2 Loose Ball Get 21 9 +12 Contested Mark 1 3 -2 Ruck Hard Ball Get 0 1 -1 Gather From Hitout 4 2 +2 Free For 1 1 0 Total 33 20 +13 Melbourne's Forward 50 Hard Ball Get 4 0 +4 Loose Ball Get 12 6 +6 Contested Mark 4 1 +3 Gather From Hitout 0 1 -1 Contested Knock On 0 1 -1 Free For 2 1 +1 Total 22 10 +12 Post clearance Hard Ball Get 11 13 -2 Loose Ball Get 52 29 +23 Contested Mark 14 10 +4 Contested Knock On 3 3 0 Free For 7 5 +2 Total 87 60 +27 Pre clearance Hard Ball Get 3 5 -2 Loose Ball Get 22 21 +1 Ruck Hard Ball Get 5 2 +3 Gather From Hitout 9 11 -2 Contested Knock On 1 3 -2 Free For 2 2 0 Total 42 44 -2 - Official data on pre- and post-clearance contested possessions are not available. These have been estimated by Wheelo Ratings and should be indicative.
- Ground ball gets are inclusive of hard ball gets and loose ball gets.
- 'Free For' does not include free kicks to advantage or free kicks while in possession of the ball as these are not counted as contested possessions.
Expected scores
xScore Score Rushed xWin % xMargin Margin Swing Melbourne 102.1 112 1 99% +35.3 +54 +18.7 West Coast 66.9 58 2 1% Team Shots Score Accuracy xScore +/- xSc. /
ShotShot
RatingOverall Melbourne 28 17.9.111 60.7% 101.1 +9.9 3.61 +0.35 West Coast 20 8.8.56 40.0% 64.9 −8.9 3.24 −0.44 General Play Melbourne 7 6.0.36 85.7% 22.4 +13.6 3.21 +1.94 West Coast 4 2.1.13 50.0% 15.5 −2.5 3.88 −0.63 Set Position Melbourne 21 11.9.75 52.4% 78.7 −3.7 3.75 −0.18 West Coast 16 6.7.43 37.5% 49.3 −6.3 3.08 −0.40 - xWin %: win probability based on expected scores.
- Swing: difference between expected margin and actual margin.
- xScore: total expected score from all shots taken.
- +/-: total score above or below expected score.
- xSc. / Shot: average expected score per shot. This represents the average shot difficulty.
- Shot Rating: average score above or below expected score per shot at goal.
Notes: Expected scores are calculated by Wheelo Ratings. Each shot at goal is assigned an expected score based on the distance from goal, shot angle, and type of shot (e.g. set shot, general play following contested possession, general play following uncontested possession, ground kick, etc) as a proxy for pressure. The model does not take into account factors like the player, whether the ball was kicked with their preferred or non-preferred foot, and pressure on the player when taking the shot. Rushed behinds are excluded from actual and expected scores.
Pressure
Team pressure
Quarter For Agn Diff 1 200 177 +23 2 179 179 0 3 186 162 +24 4 199 154 +45 Match 191 168 +23 Source: Herald Sun
Most Pressure Points
Note: pressure points are the weighed sum of pressure acts. Physical pressure acts are worth 3.75 points, closing acts are worth 2.25 points, chasing acts are 1.5 points and corralling are 1.2. ( https://www.championdata.com/glossary/afl/ )
Player Pressure
ActsPressure
PointsSeason
AverageTrent Rivers 23 55 26.8 Jack Viney 19 45 59.6 Alex Neal-Bullen 19 44 53.5 Caleb Windsor 17 39 33.3 Andy Moniz-Wakefield 13 35 31.5 Ed Langdon 18 33 30.8 Kade Chandler 13 30 45.4 Koltyn Tholstrup 13 30 37.8 Tom Sparrow 15 28 43.8 Christian Salem 10 28 27.1 Jake Bowey 10 25 16.6 Clayton Oliver 10 23 44.2 Jacob van Rooyen 10 23 16.8 Daniel Turner 9 21 13.4 Kysaiah Pickett 11 20 40.9 Tom McDonald 5 14 20.8 Judd McVee 6 13 14.9 Steven May 5 13 9.3 Bayley Fritsch 6 12 15.4 Max Gawn 4 11 23.1 Taj Woewodin 4 11 14.2 Jake Lever 2 5 14.8 Jake Melksham 3 5 5.0 Source: Herald Sun
Time in Forward Half
Quarter For Against 1 53% 47% 2 52% 48% 3 43% 57% 4 43% 57% Match 49% 51% Source: Match total sourced from the Herald Sun; quarter values are my own calculations.
Score Sources
Summary
Category Score Against Diff Kick-in 0.1.1 0.0.0 +1 Centre Bounce 0.1.1 3.2.20 -19 Stoppage (Other) 5.1.31 2.3.15 +16 Turnover 12.7.79 3.5.23 +56 Match Season Match Season * Kick-in 1 2.4 0 2.5 Centre Bounce 1 10.4 20 7.3 Stoppage (Other) 31 23.2 15 19.6 Turnover 79 43.1 23 46.4 * Against season average represents average points conceded by Melbourne across the season, not average points scored by West Coast.
Chain start region
Note: region is from the scoring team's perspective.
Match Season Match Season * Centre Bounce Centre 1 10.4 20 7.3 Kick-in D50 1 2.4 0 2.5 Stoppage (Other) D50 12 2.6 0 1.6 Stoppage (Other) Centre 7 2.2 0 2.0 Stoppage (Other) Wing 12 12.7 9 9.2 Stoppage (Other) F50 0 5.8 6 6.8 Turnover D50 19 8.8 0 7.7 Turnover Centre 8 7.1 0 7.8 Turnover Wing 46 21.1 23 24.2 Turnover F50 6 6.1 0 6.8 Match Season Match Season * D50 32 13.8 0 11.8 Centre 16 19.8 20 17.1 Wing 58 33.8 32 33.4 F50 6 11.9 6 13.6 Match Season Match Season * Defensive 50 32 13.8 0 11.8 Defensive midfield 26 19.1 10 17.8 Centre bounce 1 10.4 20 7.3 Attacking midfield 47 24.1 22 25.4 Forward 50 6 11.9 6 13.6 * Against season average represents average points conceded by Melbourne across the season, not average points scored by West Coast.
Points from defensive half
Match Season Match Season * 58 32.8 10 29.6 * Against season average represents average points conceded by Melbourne across the season, not average points scored by West Coast.
Centre Bounce Attendances
CBAs CBA % 2024 % 2023 % Trent Rivers 24 83% 16.9% 3.0% Clayton Oliver 23 79% 71.8% 81.4% Max Gawn 21 72% 84.3% 64.9% Jack Viney 19 66% 68.0% 72.1% Tom Sparrow 14 48% 38.8% 44.9% Kysaiah Pickett 7 24% 36.0% 11.2% Jacob van Rooyen 7 24% 13.9% 7.6% Daniel Turner 1 3% 0.5% 0.0% Christian Salem 0 0% 16.0% 0.0% Alex Neal-Bullen 0 0% 13.7% 2.1% Koltyn Tholstrup 0 0% 1.9% Tom McDonald 0 0% 0.0% 5.7% Christian Petracca 55.8% 61.1% Josh Schache 8.3% 0.0% Bailey Laurie 4.4% 0.0% Charlie Spargo 4.2% 0.0% Harrison Petty 3.9% 0.7% Lachie Hunter 0.0% 0.2% Ruck Contests and Hitouts
Ruck Contests
Ruck
ContestsRC % 2024 % 2023 % Max Gawn 47 60% 81.4% 57.5% Daniel Turner 16 21% 2.3% 0.0% Jacob van Rooyen 15 19% 14.3% 13.1% Alex Neal-Bullen 0 0% 0.0% 0.0% Clayton Oliver 0 0% 0.0% 0.1% Steven May 0 0% 0.0% 0.0% Tom McDonald 0 0% 0.0% 9.3% Tom Sparrow 0 0% 0.0% 0.0% Josh Schache 13.3% 4.1% Harrison Petty 4.8% 2.0% Ben Brown 0.2% 2.3% Christian Petracca 0.0% 0.4% Hitouts
Ruck
ContestsHitouts To
Adv.To Adv. %
(2024)To Adv. %
(2023)Max Gawn 47 21 8 26.9% 30.1% Jacob van Rooyen 15 5 1 24.1% 31.1% Daniel Turner 16 2 1 50.0% Alex Neal-Bullen 0 0 0 0.0% Tom McDonald 0 0 0 20.0% Ben Brown 100.0% 0.0% Josh Schache 100.0% 0.0% Harrison Petty 31.8% 25.0% Christian Petracca 100.0% Opposition hitouts
Ruck
ContestsHitouts To
Adv.Bailey J. Williams 61 28 10 Jack Darling 12 5 2 Jack Williams 5 1 0 There are some very curious stats this week, but one in particular stands out.
We had more 1.1 km metres gained than the Eagles.
Which is incredible.
In previous seasons, with our forward half game that would not be that remarkable - but it is this year. I suspect it might be our biggest diff for metres gained all season.
Normally such a differential, for any club, but in seasons past particularly us, would correlate with smashing the oppo for inside 50 and time in forward half.
But we were dead even for inside 50s and 49% to their 51% for time in forward half.
@Binmans PA, I wondered if one factor for these seemingly contradictory numbers might be related to the point you have made a few times about how deep our defence often sits this season - ie we often win the ball back deep in our defence, effectively lengthening the ground.
Thoughts?
Amy other theories?
-
1
-
Thanks wheelo.
Coincidentally, I'm on the train to work and just downloaded the wheelo app.
Brilliant product. Great navigation. Easy to use. Visually works really well. Kudos.
A question, how are team ratings calculated (I know it's a combo of attack and defence, but how are the scores for each determined)?
-
1
-
1
-
-
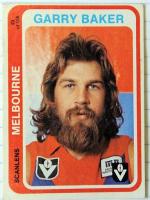
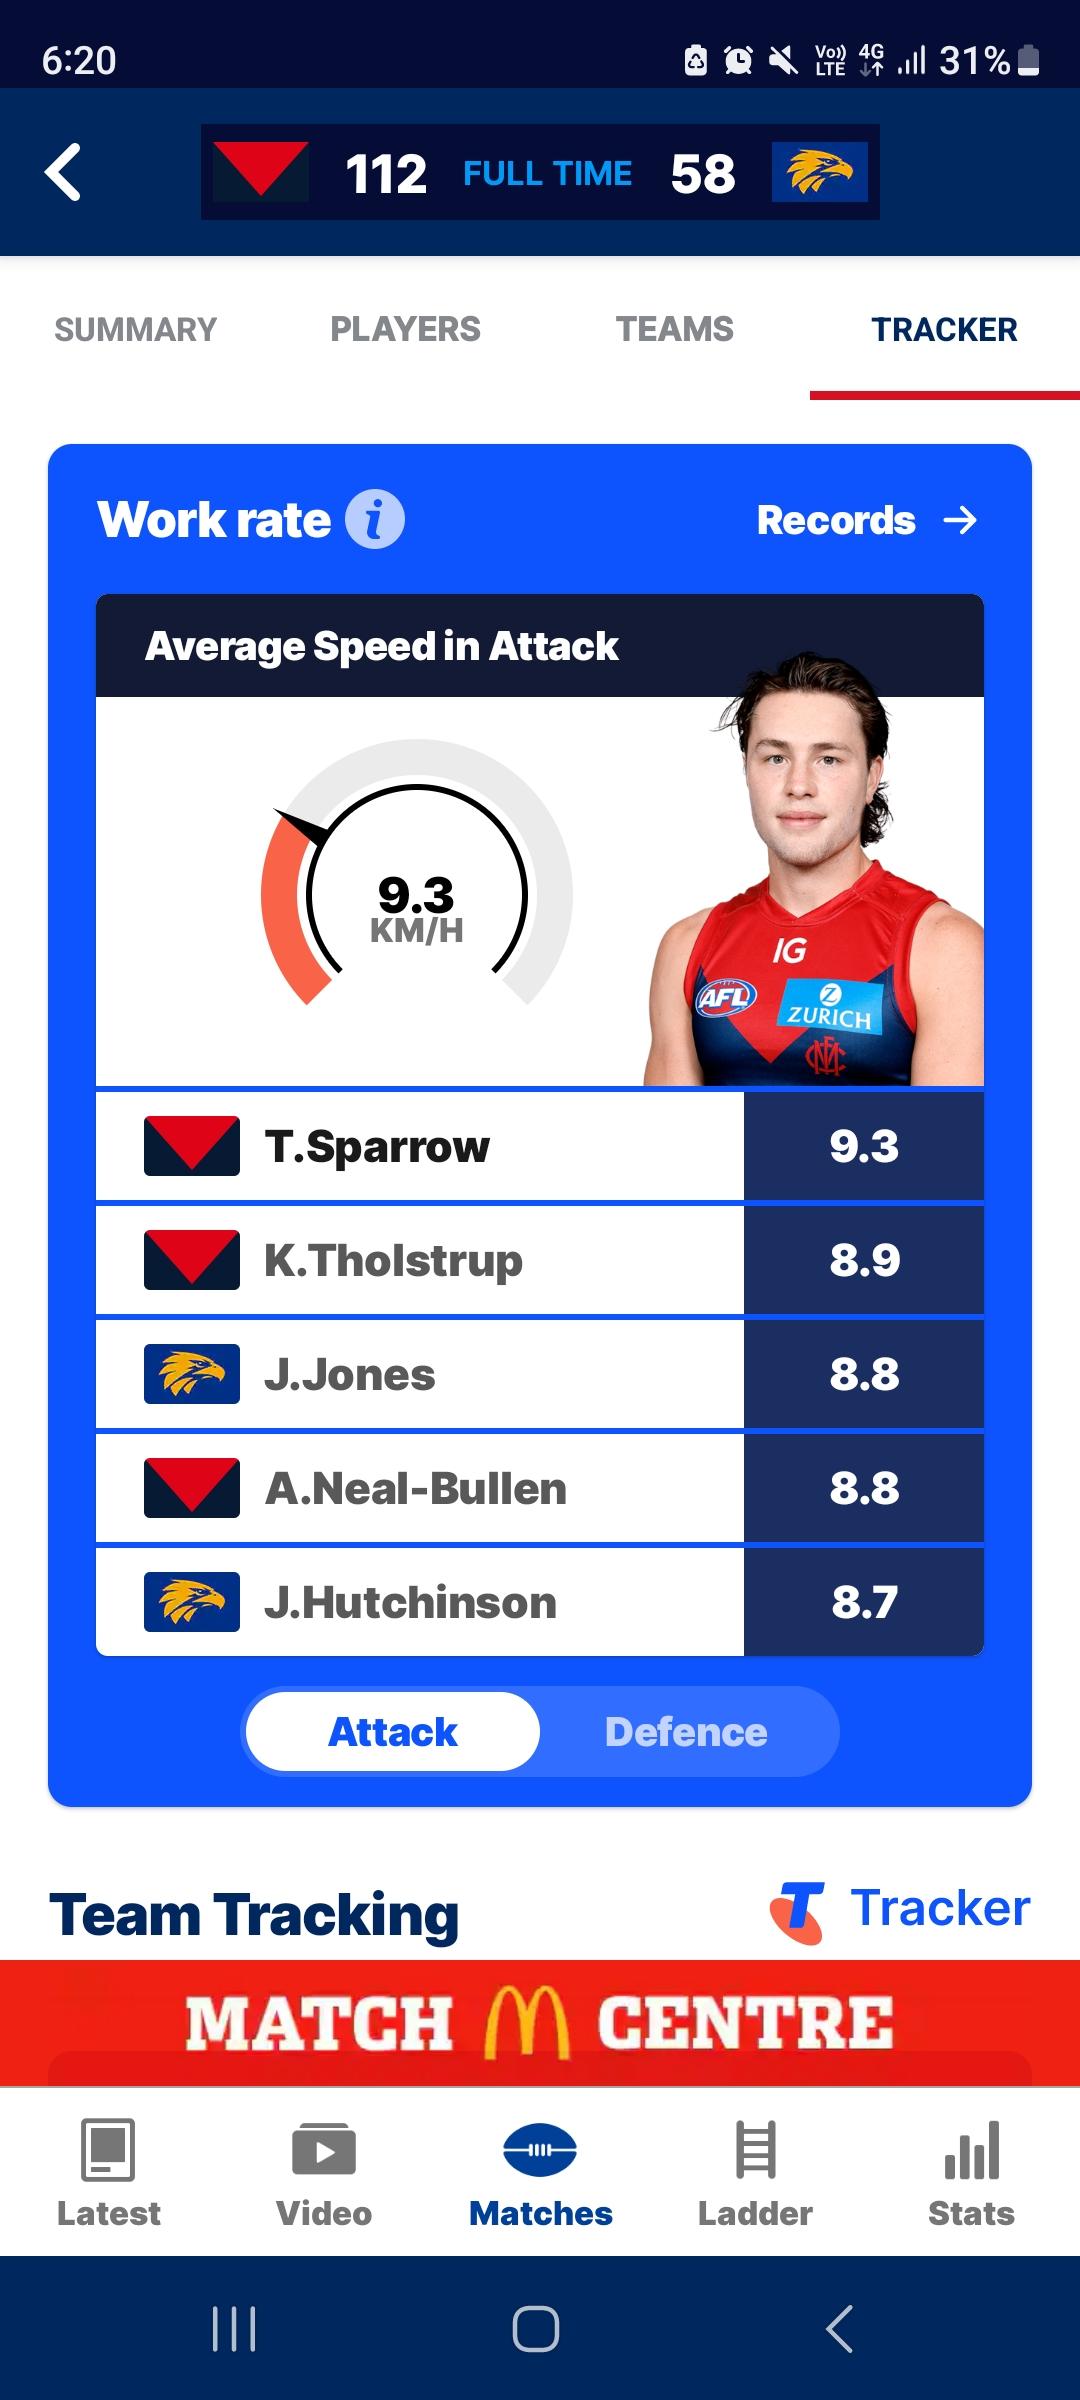
6 hours ago, Rocknroll said:
Runs hard
Runs fast (check out his tracker results)
Uses footy well
Tough
Got a bit of x factor
But the best you gotta love the curls
Spot on - on all counts.
He's the love child of jackovich and Brett Lovett.
i had checked the tracker and was surprised how quick he is (note: average speed in attack is running when we have the ball).
And clearly a super hard worker, as evidenced by topping average speed in defence (note: running when the opponents have the ball - the best indicator of work rate and spread).

-
8
-
 5
5
-
2
-
1
-
-
6 hours ago, whatwhat say what said:
cmon @binman, take some q's!
who is the most promising of our 22 and under brigade and who will end up the best player? deep dive into stats may be required
I can take that one. Have already run the numbers on one young gun.
-
1
-
2
-
1
-
-
2 hours ago, whatwhat say what said:
no, that's mcvee
having mcvee and amw will be fantastic for years to come i hope; two small defenders who can both lock down and provide rebound run
If AMW can take the quality small forwards like Cody weightman and Bobby Hill, Mcvee is freed up to play higher up the ground, where his beautiful kicking and elite decision making can be even more damaging.
-
8
-
2
-
1
-
-
4 hours ago, Demon Jack said:
I still see him as a defender long term, especially after May retires in the next 2-3 years but he's made a great fist of it as a forward thus far this season.
The old reverse Neita.
-
1
-
-
4 hours ago, adonski said:
I think Petty will come in for Disco rightly or wrongly
Would like to see AMW stay in
I would not be surprised if AMW keeps his spot in the team going forward.
He's been terrific. Strong in the contest, and a good user.
And he has something that all teams want - genuine leg speed.
Could he be the small defender we've missed since jetts in 2018?
-
11
-
1
-
-
13 minutes ago, DubDee said:
hope your team won this weekend to cheer you up
Who do you reckon they barrack for?
I'm tipping the pies.
-
2
-
2
-
-
Mark Murphy's votes on abc radio were
3 Rivers
2 JVR
1 Windsor
The kids are alright
-
27
-
3
-
-
We're on?
-
1
-
1
-
PREGAME: Rd 18 vs Essendon
in Melbourne Demons
Posted
Verall because at some point we need to replace maxy, who by the by also spent a long time in the magoos.
Fullers because he was on the market, in our price range and worth a gamble.
It's on fulllers that he hasn't made it impossible to not select with a body of work in the VFL.