WheeloRatings
Members
-
Joined
-
Last visited
Everything posted by WheeloRatings
-
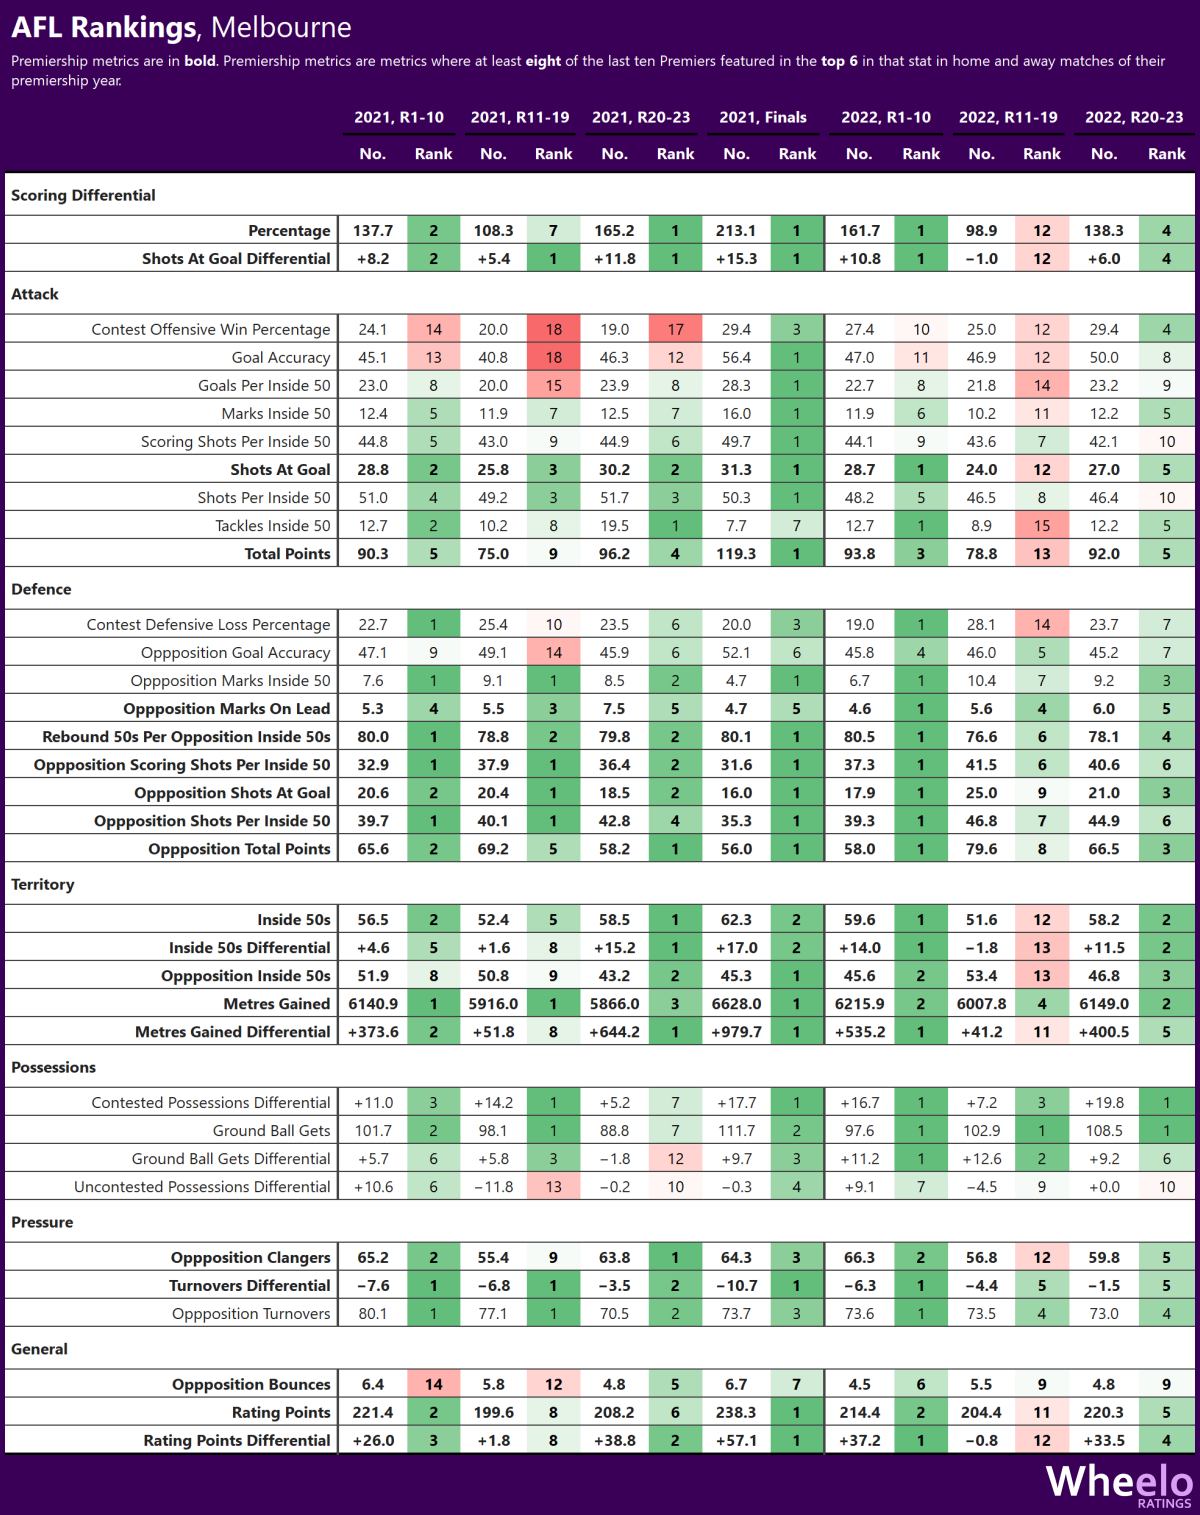
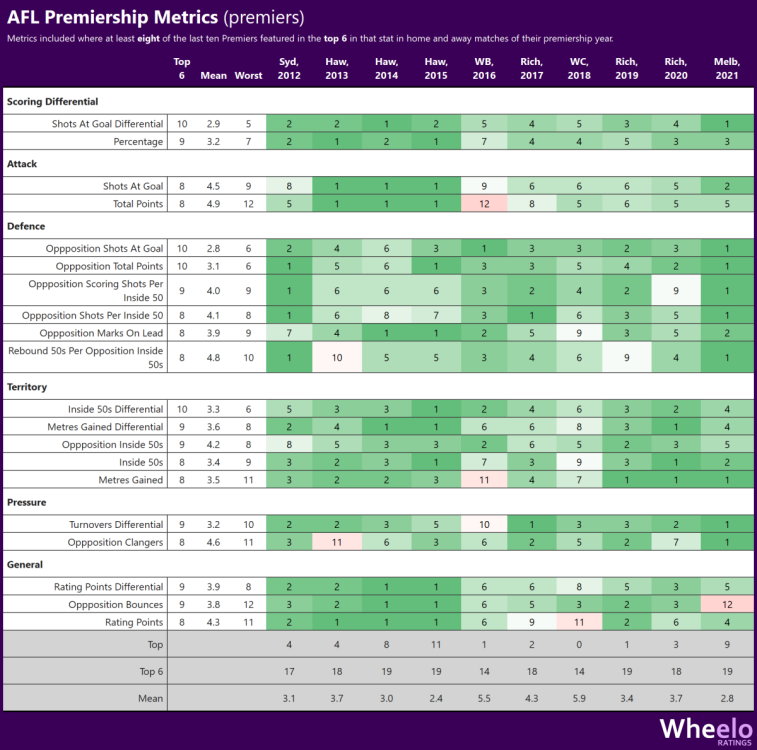
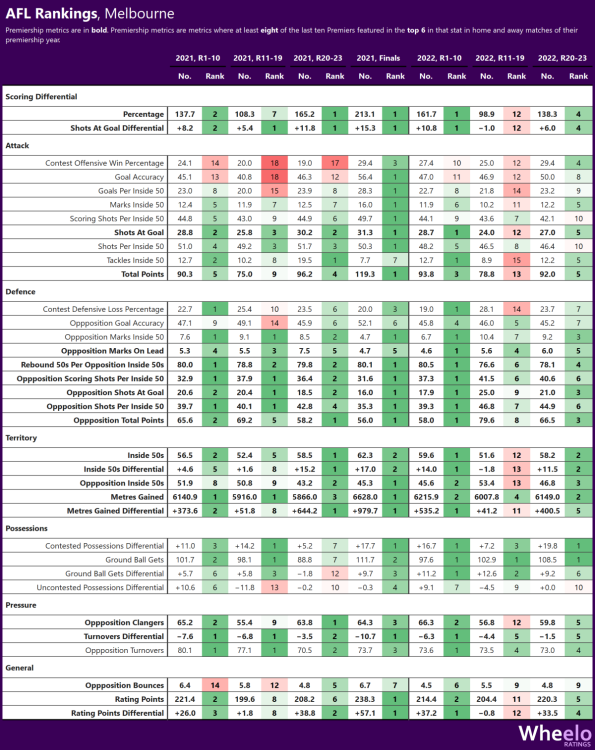
End of Home and Away Season Update Firstly, thanks @Demonland @binman @george_on_the_outer for briefly touching on this thread in last week's podcast. Here is an update to the Premiership Metrics following the end of the home and away season. I have updated the methodology to look at the past ten premiers in home and away matches only and removed some measures which were effectively duplicates. I have also grouped the metrics into categories to make the tables easier to read. With these updates, there are 20 statistical categories in which at least eight of the last ten premiers ranked in the top 6. Eight of the last ten premiers were ranked in the top 6 in at least 17 of these 20 categories (the Western Bulldogs in 2016 and West Coast in 2018 ranked in the top 6 in 14 categories). "Premiership Metrics" ranked in the top 6 in 2022 (out of 20) 19: Geelong 19: Melbourne 14: Sydney 11: Fremantle 10: Richmond 10: Brisbane 8: Collingwood 8: Western Bulldogs What are the Premiership Metrics? Where do teams ranks against these metrics in 2022? Melbourne Here are Melbourne's rankings for rounds 1-10, 11-19, 20-23 for both 2021 and 2022 and finals in 2021. In addition to the so-called "Premiership metrics" (in bold), I have included several other stats of interest. If anyone has any requests for inclusion of additional stats (from https://www.wheeloratings.com/afl_stats_team.html), let me know. Please note that Melbourne's comparatively harder fixture in the second half of this season compared to last season will have an impact on the rankings.

-
Thanks @Hellish Inferno I will posting an update soon. I will also look at Melbourne's rankings for rounds 1-10, 11-19 and 20-23 for this season and last season, and finals last year.
-
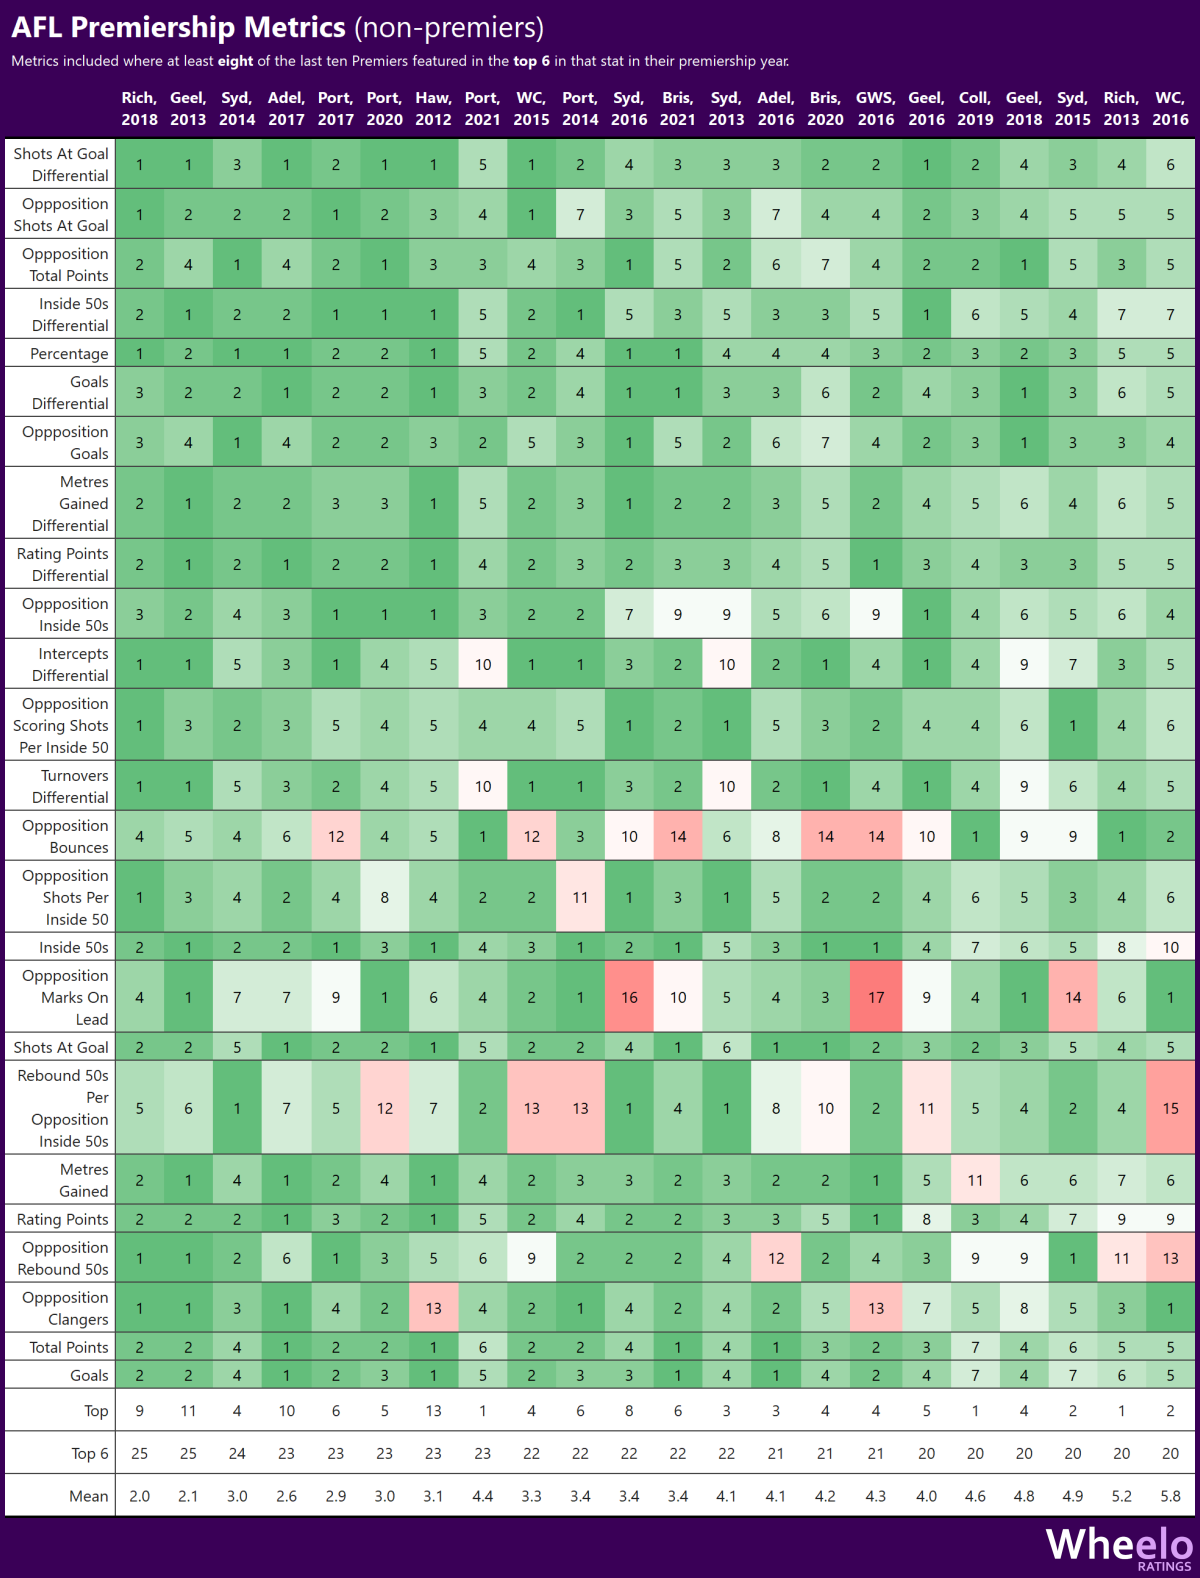
Thanks! I re-ran the analysis for just home and away matches and looked at teams that did not win the premiership, and dominating these metrics certainly doesn't guarantee a premiership. The updated H&A version has 25 metrics - Hawthorn 2012 were #1 in 13 metrics, Geelong 2013 were #1 in 11, Adelaide 2017 were #1 in 10. Also, Richmond 2018 and Geelong 2013 were top 6 in all 25.

-
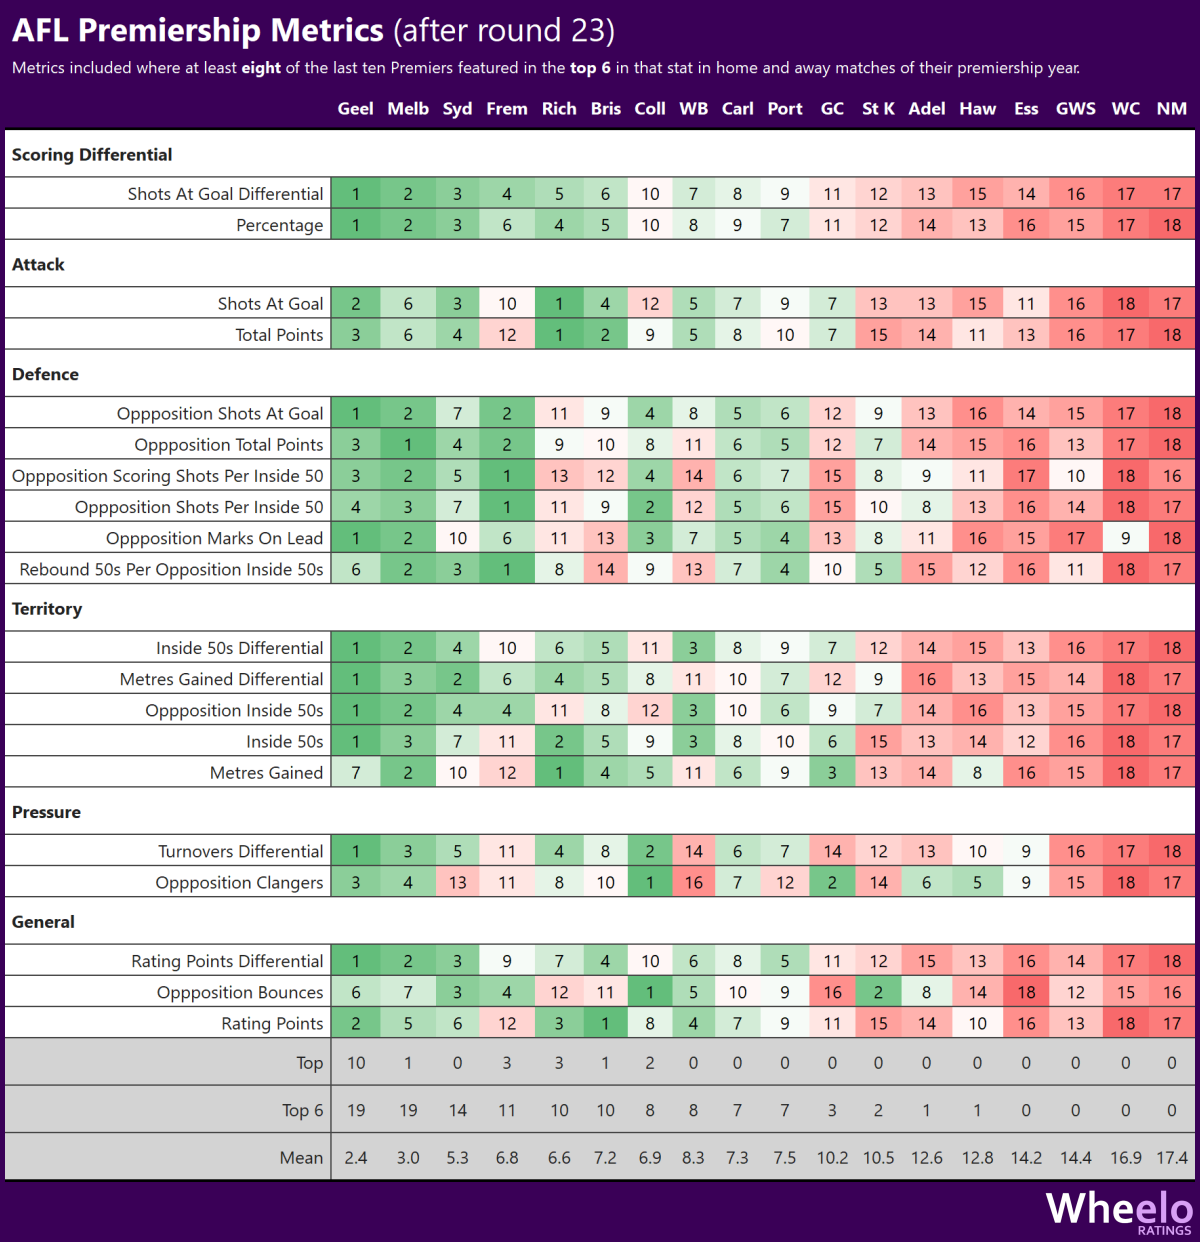
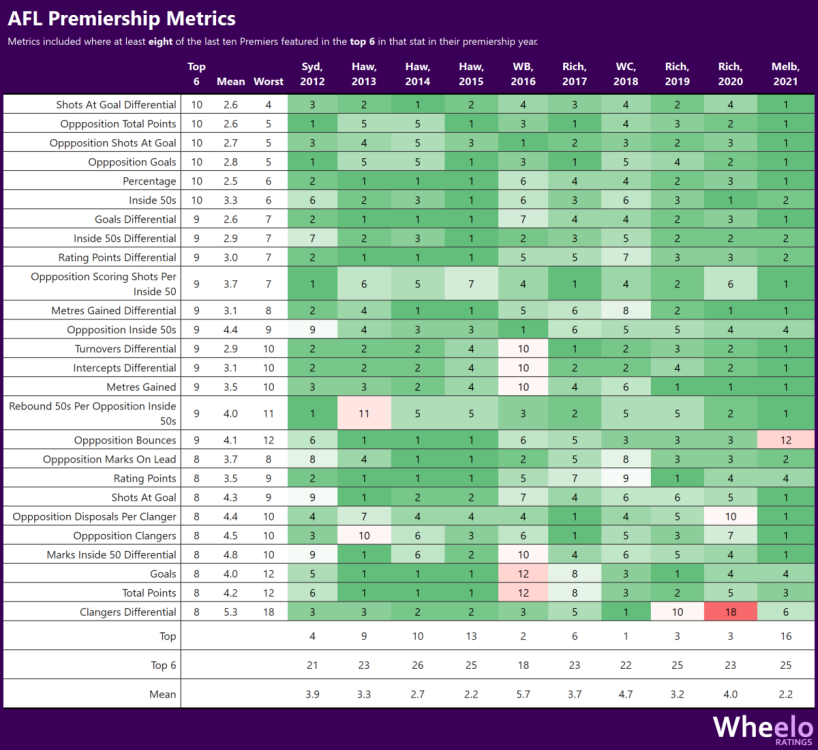
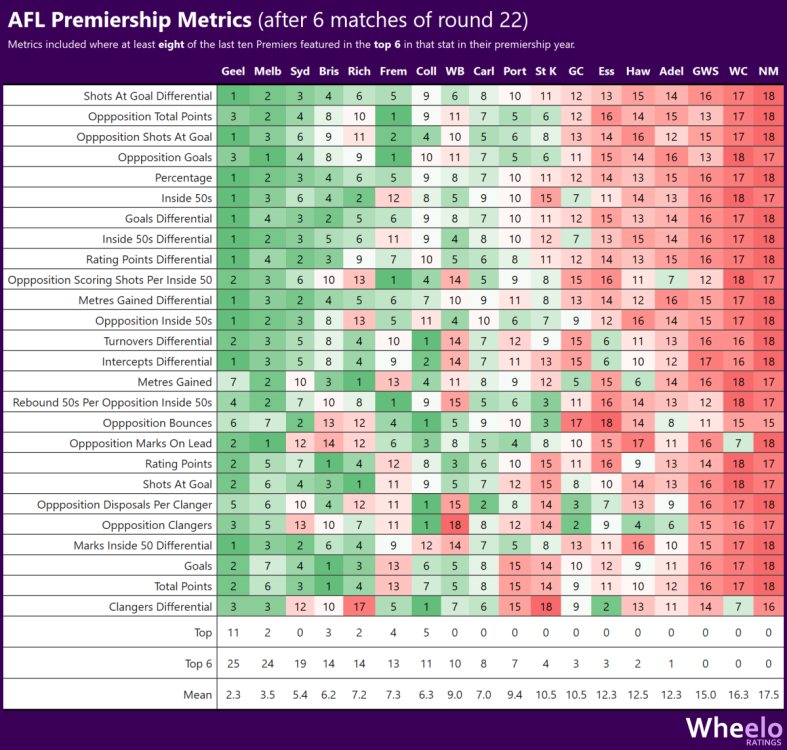
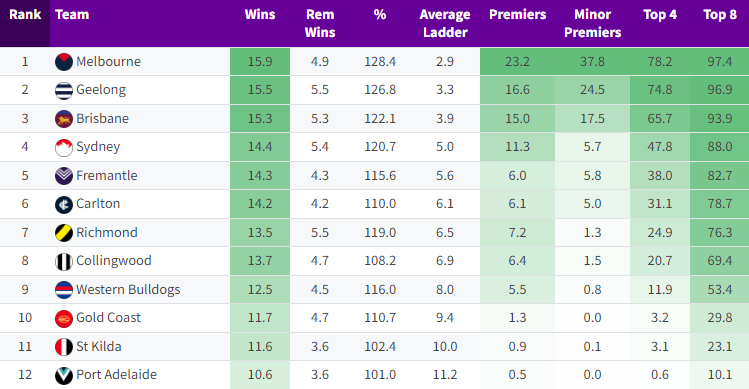
What do the last ten premiership teams have in common? They were all ranked in the top 6 in the following statistical categories in their premiership year: Shots at goal differential (all ranked top 4) Total points conceded Opposition shots at goal Opposition goals Percentage Inside 50s Following on from the thread H&A % as an indicator of team chances to win Finals, I decided to look at what stats (including percentage) recent premiership teams have in common using a somewhat simplistic methodology. I have analysed the ranks of the last ten premiership teams against a large number of statistical categories in their premiership year. There are 26 statistical categories in which at least eight of the last ten premiers ranked in the top 6. The list of the 26 categories are in the images at the end of this post. Nine of the last ten premiers were ranked in the top 6 in at least 21 of these 26 categories (the Western Bulldogs ranked in the top 6 in 18 categories in 2016). Melbourne ranked number 1 in 16 of these categories last year, more than any other premiership team in the last ten years. There are currently three standout teams this season for these "premiership metrics" - Geelong, Melbourne and Sydney. "Premiership Metrics" ranked in the top 6 in 2022 25: Geelong ⭐ 24: Melbourne ⭐ 19: Sydney ⭐ 14: Brisbane 14: Richmond 13: Fremantle 11: Collingwood 10: Western Bulldogs 8: Carlton What are the Premiership Metrics? Where do teams ranks against these metrics in 2022?
-
Win Production Function: http://www.matterofstats.com/mafl-stats-journal/2011/5/22/win-production-functions-for-afl-teams-1897-to-2010.html
-
Matter of Stats posts an AFL Team Dashboard after each round which includes their "WPF Expected Wins" (last column in first image below) rank and the "Expected Win %" (far right of middle table of second graphic below). Melbourne 3rd, Collingwood 9th. http://www.matterofstats.com/mafl-team-dashboards/matterofstats-2022-team-dashboard-for-round-21 Matter of Stats formula: X = 0.164 x (SS For - SS Against) + 6.18 x (Own Conversion - Opponent Conversion) Expected(Wins) = exp(X)/(1+exp(X)) While this isn't the Pythagorean expectation formula, in Matter of Stats' Pythagorean expectation post he indicated that "we find that the optimal value of k oscillates around 2 from about the late 1930s onwards". I haven't tried applying the Pythagorean expectation model myself.
-
Ha, that had crossed my mind! The name combines my surname (Whelan) and elo ratings - and I was hoping people wouldn't put the emphasis on the 'O'! 😂
-
His set shot accuracy (20%) is actually worse than his accuracy in general play (31%). This was posted on Twitter recently:
-
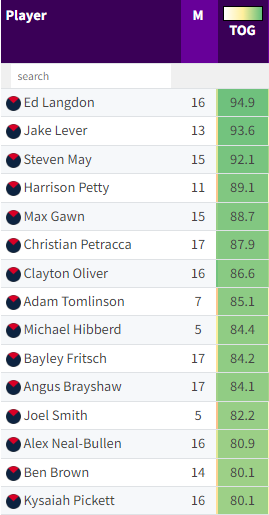
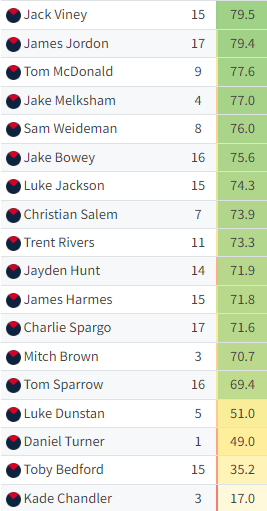
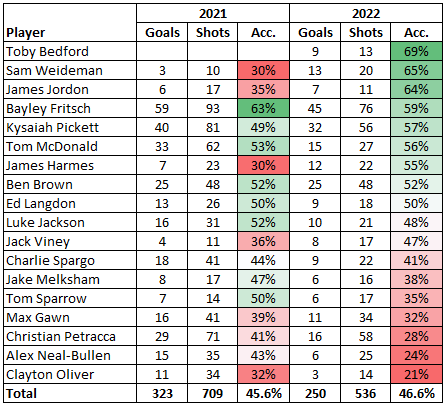
Yes, here are all our players with 10+ shots this year and a comparison to last year, noting that our overall accuracy is higher than last year.
-
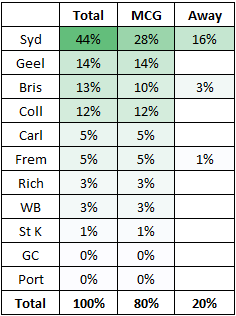
Here's an update of my simulations following round 20, with Melbourne most likely playing Sydney in the first week of finals. Sydney has a relatively easier draw than Collingwood so will quite possibly finish higher than Collingwood. Likely opponent in first week of finals, noting that I have all Victorian matches at the MCG
-
@crow_data_sci posted some interesting stats on Twitter regarding the use of the medi-sub. Port Adelaide has had the most players subbed off and play the next week in both of the last two years (5 in 2021, 4 in 2022). Melbourne and Sydney have had no player subbed off and play the next week at all across the last two seasons. Source:
-
I have a model that rates teams based on past results and the current team ratings are here: https://www.wheeloratings.com/afl_ratings.html The model estimates match win probabilities based on the current team ratings and venue advantage. For example, my model rates Melbourne a 48.5% chance of winning this week. Each week, I simulate the remainder of the season 50,000 times based on those win probabilities. So roughly 48.5% of the simulations will result in a Melbourne win against Fremantle and 51.5% will result in a Fremantle win (although a proportion of matches will end in a draw too). I do simulate match margins too based on a normal distribution with a mean of the expected margin so it does allow a team with easier matches to increase their percentage, although Sydney does have some ground to make up. My model doesn't rate Collingwood that highly given they've had so many wins by small margins, so they could potentially outperform my model's expectations and therefore somewhat reduce Melbourne's chances of finishing top 4 in the two win scenario.
-
I agree they shouldn't be taken lightly and I won't be confident at all when we play them. They are 8-1 in games decided by 12 points or less, which is an amazing record (don't get me wrong). They have done very well to win all those close games but there's an element of luck in winning close games. They gave away a free kick to Essendon in front of goal inside the last minute. If they kick that goal, Collingwood lose and they're 7th. I don't want to take anything away from them subsequently going coast-to-coast and Elliott kicking an incredible goal after the siren, but they weren't in control of the Essendon shot at goal. I'm not saying they're not a good side, I just think that 13-5 and 4th flatters them a little bit considering their % is only 106.
-
Yes, realistically we should start favourites against Collingwood and Carlton as well. Collingwood has won a lot of close games so their ladder position probably flatters them somewhat.
-
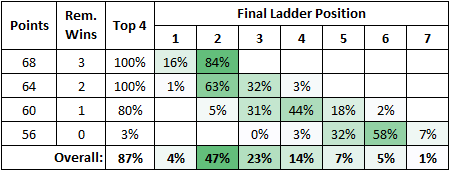
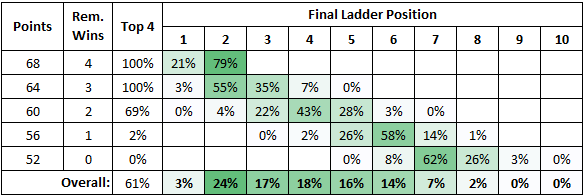
Based on my simulations (50,000 simulations of the remainder of the season), this is what I get for Melbourne's probability of finishing in each ladder position for a certain number of wins over the last four rounds.
-
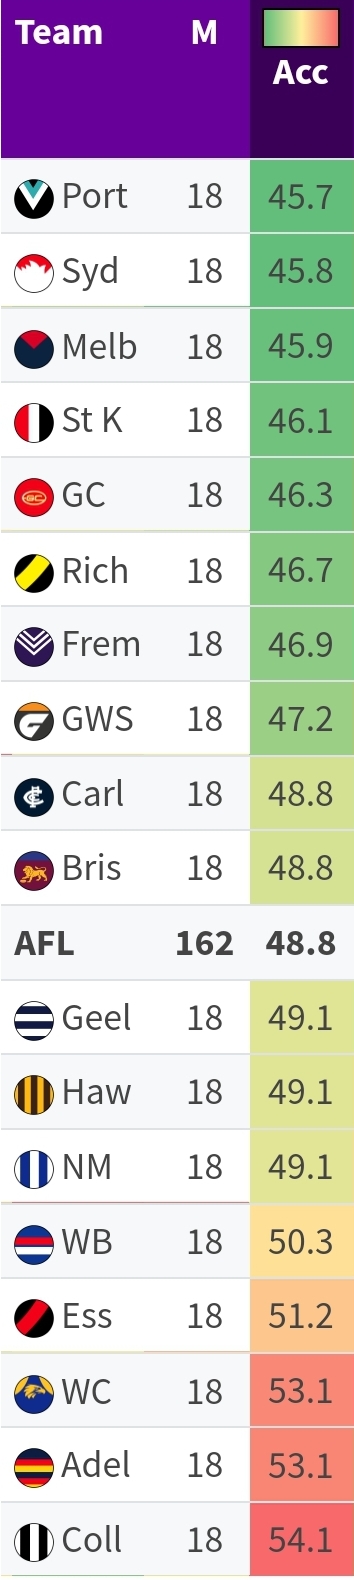
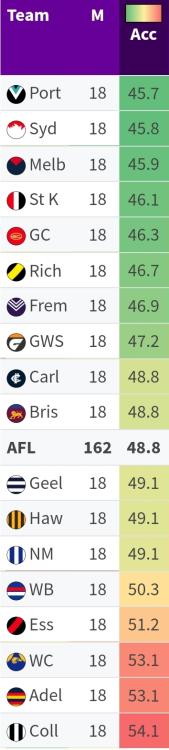
In terms of Goals ÷ Shots, which is Champion Data's Accuracy metric, Melbourne's actually the third best in terms of opposition accuracy. This metric takes into account shots at goal that don't score at all but won't include rushed behinds that were not as a result of a missed shot. Accuracy doesn't take into account shot difficulty (location, pressure) which is where expected score can be useful. I'm not at my computer at the moment so can't delve deeper.
-
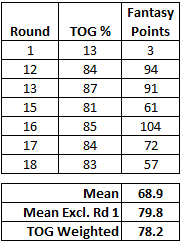
I agree that extrapolation of a player's rating (or any stat) based on game time is somewhat meaningless. However, taking game time into account in aggregating player averages across a season can be useful particularly for medi-subs and players injured during a match who may only be on the ground for a very short time or not at all. Instead of extrapolating a particular stat, a weighted average by game time could be calculated for a particular stat across the season. Salem, for example, only played 13% game time in round 1 which significantly reduces his averages. His average fantasy points is 68.9 across the season but 79.8 excluding round 1. His weighted average based on game time is 78.2 which is probably a better reflection of his average output.
-
It won't be as it's in Hobart on the 29th and 30th (so good for me).
-
-
I guess that depends on whether you assign different scores/weights to different stats. E.g. is a goal worth more than a score involvement? If so, you could adjust the weight that you assign to a goal to account for the fact the player will also be credited a score involvement. Hypothetical Example If a goal was worth 8 points, a behind 1 point, and a score involvement 0.5 points, then effectively a goal is actually worth 8.5 points, a behind 1.5 points and other score involvements worth 0.5 points. If you subtracted the 0.5 points from the value of a goal and behind and assign 7.5 points for a goal and 0.5 points for a behind, then a goal would effectively be worth 8 points and a behind 1 point. Another way to achieve the same result would be to subtract a player's goals and behinds from their score involvements. So a player scoring 2 goals 1 behind with 8 total score involvements, had 5 "non-scoring" score involvements for want of a better term. But I wouldn't necessarily suggest you remove score involvements altogether as they are an informative stat.
-
I agree with your interpretation of why they have the "score assist" stat, in addition to the goal assist. I guess I can understand the contested mark / free kick scenario, in that (a) both relate to the way the player took possession of the ball so it was either a mark or a free kick, and (b) the umpire would pay the free kick instead of a mark, which may be because the advantage rule remains an option, as there's no advantage from a mark. I don't mind the hit-out to advantage not being paid when a free kick was paid in the ruck contest too. I agree it seems unfair, but the free kick was paid first so I suppose I get it.
-
Yes indeed, it does seem a little off! Melbourne's rating is currently 5 points higher than Brisbane but the home ground advantage is +11 points to Brisbane (rightly or wrongly). The model doesn't put too much weight on a single match result, just like it doesn't weight Melbourne's three losses too heavily.
-
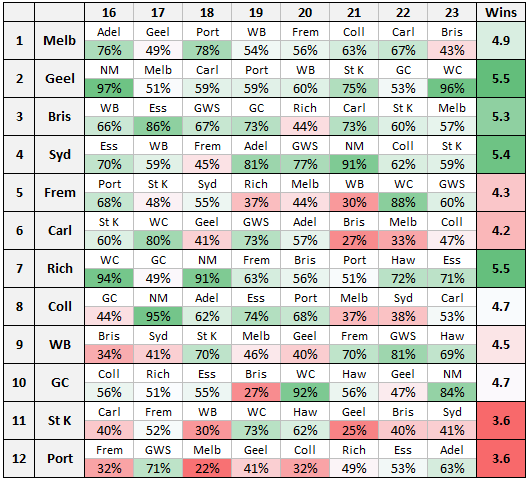
Notwithstanding @old dee's comment that we will win them all, here are each team's chances of winning each remaining match based on my model.
-
Here's mine:
-
@Demon Dynasty @deanox I can confirm that the score involvements do include the player's own goals and behinds. The giveaway is that a player always has at least as many score involvements as own scores. I guess the 'score involvements' metric is meant to stand on its own, as opposed to supplementing the goals/behinds.