WheeloRatings
Members
-
Joined
-
Last visited
Everything posted by WheeloRatings
-
Here are the updated season tallies for all Melbourne players: 36 Clayton Oliver 33 Christian Petracca 12 Brodie Grundy 12 Kysaiah Pickett 11 Max Gawn 11 Jake Lever 6 Ed Langdon 6 Jack Viney 6 Kade Chandler 5 Angus Brayshaw 4 Michael Hibberd 2 Tom McDonald 1 Lachie Hunter https://www.wheeloratings.com/afl_stats.html
-
Melbourne v Gold Coast https://www.wheeloratings.com/afl_match_stats.html?ID=20230804 Note: first number below is Melbourne, higher value is bold. Pressure Q1: 186 - 193 Q2: 179 - 178 Q3: 179 - 166 Q4: 191 - 172 Tot: 184 - 177 Most Pressure Points Viney: 65 Sparrow: 62 Pickett: 53 Oliver: 44 Neal-Bullen: 42 Petracca: 38 Gawn: 37 van Rooyen: 36 Time in forward half 56% - 44% Score sources Centre bounce 1.3.9 - 0.0.0 Ball up 0.1.1 - 2.4.16 Throw in 1.2.8 - 4.1.25 Turnover 11.6.72 - 6.2.38 Kick-in 0.0.0 - 1.0.6 Shots at goal Set position 5.5.35 - 8.4.52 General play 8.5.53 - 5.2.32
-
Here are the updated season tallies for all Melbourne players: 33 Christian Petracca 29 Clayton Oliver 12 Brodie Grundy 12 Kysaiah Pickett 11 Jake Lever 8 Max Gawn 6 Ed Langdon 6 Jack Viney 6 Kade Chandler 5 Angus Brayshaw 4 Michael Hibberd 2 Tom McDonald 1 Lachie Hunter https://www.wheeloratings.com/afl_stats.html
-
@binman The time in forward half and pressure stats are only available through the digital copy of the Herald Sun newspapers, so I actually need to manually transcribe them. I'm happy to do that here, for the Melbourne games, but it's probably a step too far to add it to my site without an automated process. It's unfortunate that it's provided to the media outlets but there's no way to download the data. I can go back and get the data for the first five games if you like. The score source data need to be derived from a raw play-by-play AFL API data source, but I haven't incorporated this information into my website yet as this will take a bit of work. I may do that at some point, but in the meantime I will just manually add it to this thread.
-
Melbourne v North Melbourne https://www.wheeloratings.com/afl_match_stats.html?ID=20230705 Note: first number below is Melbourne, higher value is bold. Pressure Q1: 189 - 185 Q2: 169 - 161 Q3: 168 - 160 Q4: 153 - 139 Tot: 169 - 163 Most Pressure Points Sparrow: 62 Chandler: 48 Viney: 41 Oliver: 39 Pickett: 38 Neal-Bullen: 31 Hunter: 31 Langdon: 30 Time in forward half 60% - 40% Score sources Centre bounce 4.1.25 - 0.0.0 Ball up 3.2.20 - 1.2.8 Throw in 3.1.19 - 0.1.1 Turnover 10.3.63 - 6.4.40 Kick-in 2.0.12 - 0.0.0 Shots at goal Set position 15.1.91 - 6.3.39 General play 7.2.44 - 1.2.8 Expected scores 111 - 53
-
-
Here are the season tallies for all Melbourne players: 23 Christian Petracca 22 Clayton Oliver 12 Brodie Grundy 11 Jake Lever 9 Kysaiah Pickett 8 Max Gawn 6 Ed Langdon 6 Jack Viney 4 Michael Hibberd 2 Tom McDonald 1 Kade Chandler 1 Lachie Hunter https://www.wheeloratings.com/afl_stats.html
-
-
I found out that the time in forward half stats are published in the Herald Sun, so I have subscribed to that and I'll see if it's worth keeping the subscription. I have added time in forward half and pressure for last night below. Also, I am able to calculate the score sources from one of my datasets so I have included that information below. Melbourne v Richmond https://www.wheeloratings.com/afl_match_stats.html?ID=20230608 Note: first number below is Melbourne, higher value is bold. Pressure Q1: 173 - 187 Q2: 159 - 162 Q3: 154 - 171 Q4: 188 - 157 Tot: 168 - 169 Time in forward half 47% - 53% Score sources Centre bounce 2.0.12 - 1.3.9 Ball up 0.0.0 - 3.0.18 Throw in 2.0.12 - 1.0.6 Turnover 11.6.72 - 6.9.45 Kick-in 0.0.0 - 0.0.0 Expected scores 77 - 85 Score sources, Rounds 1 - 6 Centre bounce v WB: 2.0.12 - 0.1.1 v Bris: 1.0.6 - 2.1.13 v Syd: 3.3.21 - 2.4.16 v WC: 1.1.7 - 1.1.7 v Ess: 2.3.15 - 4.2.26 v Rich: 2.0.12 - 1.3.9 Ball up v WB: 0.3.3 - 1.1.7 v Bris: 1.0.6 - 3.0.18 v Syd: 2.1.13 - 2.1.13 v WC: 4.4.28 - 1.1.7 v Ess: 1.1.7 - 1.1.7 v Rich: 0.0.0 - 3.0.18 Throw in v WB: 2.1.13 - 2.0.12 v Bris: 3.0.18 - 4.1.25 v Syd: 3.0.18 - 2.1.13 v WC: 4.1.25 - 2.1.13 v Ess: 1.1.7 - 0.2.2 v Rich: 2.0.12 - 1.0.6 Turnover v WB: 11.9.75 - 5.9.39 v Bris: 7.4.46 - 5.7.37 v Syd: 13.4.82 - 5.6.36 v WC: 10.6.66 - 4.5.29 v Ess: 5.6.36 - 10.9.69 v Rich: 11.6.72 - 6.9.45 Kick-in v WB: 2.0.12 - 1.0.6 v Bris: 1.0.6 - 0.0.0 v Syd: 0.0.0 - 1.0.6 v WC: 0.0.0 - 1.1.7 v Ess: 2.0.12 - 0.0.0 v Rich: 0.0.0 - 0.0.0
-
-
-
What are the Power Rankings? This is our attempt to rank every AFL club from best to worst. We take wins and losses into account, but also the quality of opposition faced and whether teams are likely to get healthier or improve going forward. It’s a little bit ‘who’s hot and who’s not’; part predictive, part analysis of what’s happened. If Team A is above Team B, we’d probably tip A to win if they were playing at a neutral venue this weekend. Source: https://www.foxsports.com.au/afl/afl-2023-power-rankings-after-round-5-analysis-highlights-every-club-ranked-ladder-predictions-contenders-latest-news/news-story/4f9d285140f1064353234930b2d313a4 Several of the Squiggle models have similar "Power Rankings" here, each with its own methodology: https://squiggle.com.au/power-rankings/
-
-
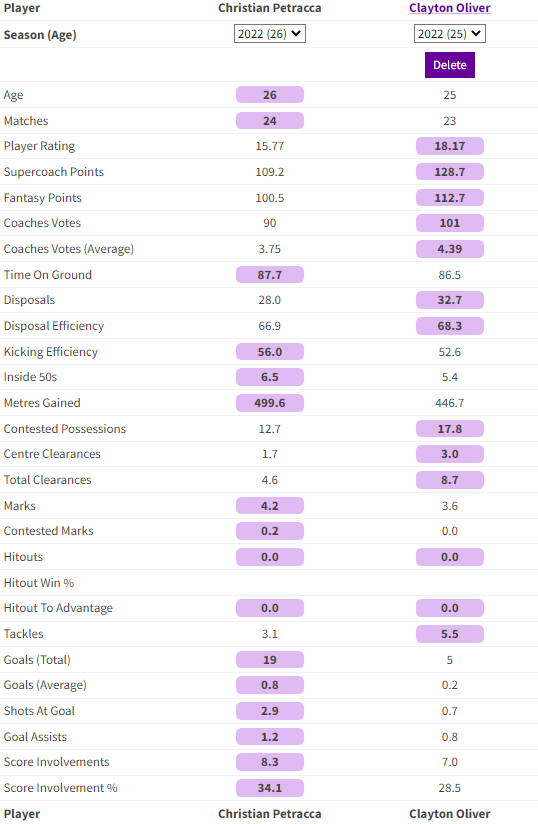
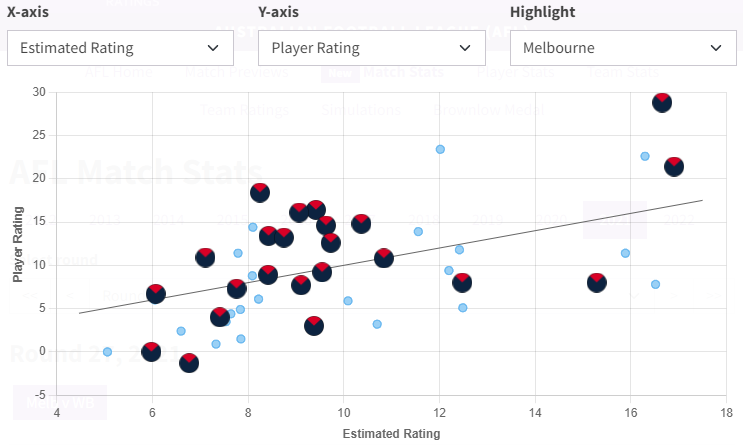
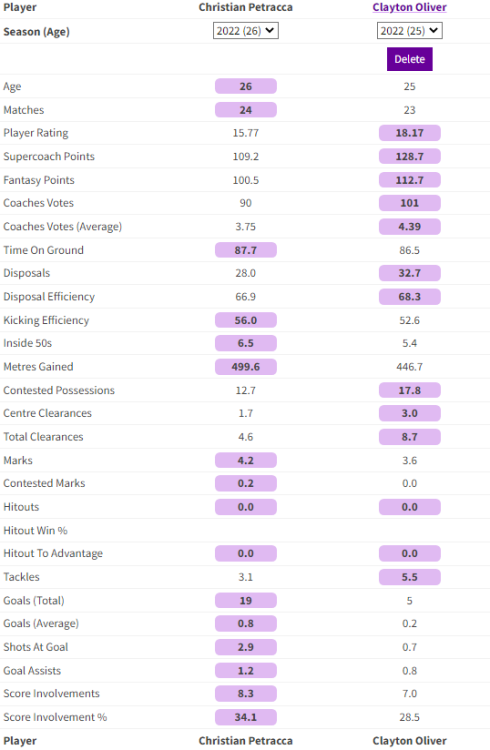
For those who aren't aware, I manage a website Wheelo Ratings that has a range of AFL stats available. I have added quite a bit of functionality since last season, including player and team stats back to 2012, individual player profiles, match stats, and interactive charts. Here are some of the key pages and features. I will probably add new functionality as the season progresses but if anyone has any suggested features, let me know. Player Stats (2012-) https://www.wheeloratings.com/afl_stats.html Key features: View all statistical categories or save your favourites. Includes 60+ stats, including AFL player ratings, coaches votes, centre bounce attendances, one-on-one contests, ruck contests and all your usual stats. Filter by team, position, etc. Interactive scatter plot, with the option of highlighting players from a particular team. Download data as csv file. Team Stats (2012-) https://www.wheeloratings.com/afl_stats_team.html Key features: Team averages, opposition averages, differential. Interactive scatter plot. Download data as csv file. Match Stats (2012-) https://www.wheeloratings.com/afl_match_stats.html Key features: View specific match or all matches for a particular round. Interactive scatter plot. Download data as csv file. Grand Final 2021: https://www.wheeloratings.com/afl_match_stats.html?ID=20212701 Player Profiles (players who have played AFL since 2012) https://www.wheeloratings.com/afl_player_profile.html Key features: View stats for each season, including overall career. Trend chart by season. Compare a player with up to four other players. Search for players or navigate from links on player stats and other relevant pages. Clayton Oliver: https://www.wheeloratings.com/afl_player_profile.html?ID=2db9dd Christian Petracca: https://www.wheeloratings.com/afl_player_profile.html?ID=231162 Max Gawn: https://www.wheeloratings.com/afl_player_profile.html?ID=22f360 Jack Viney: https://www.wheeloratings.com/afl_player_profile.html?ID=22f8be Steven May: https://www.wheeloratings.com/afl_player_profile.html?ID=22ce7d Bayley Fritsch: https://www.wheeloratings.com/afl_player_profile.html?ID=14074de Angus Brayshaw: https://www.wheeloratings.com/afl_player_profile.html?ID=2311a7 Team Annual Summary (1897-) https://www.wheeloratings.com/afl_annual_summary.html Key features: View win/loss records and team ratings for all seasons in VFL/AFL history. Interactive scatter plot.
-
The AFL website and app have a Brownlow Tracker where you can see the full leaderboard.
-
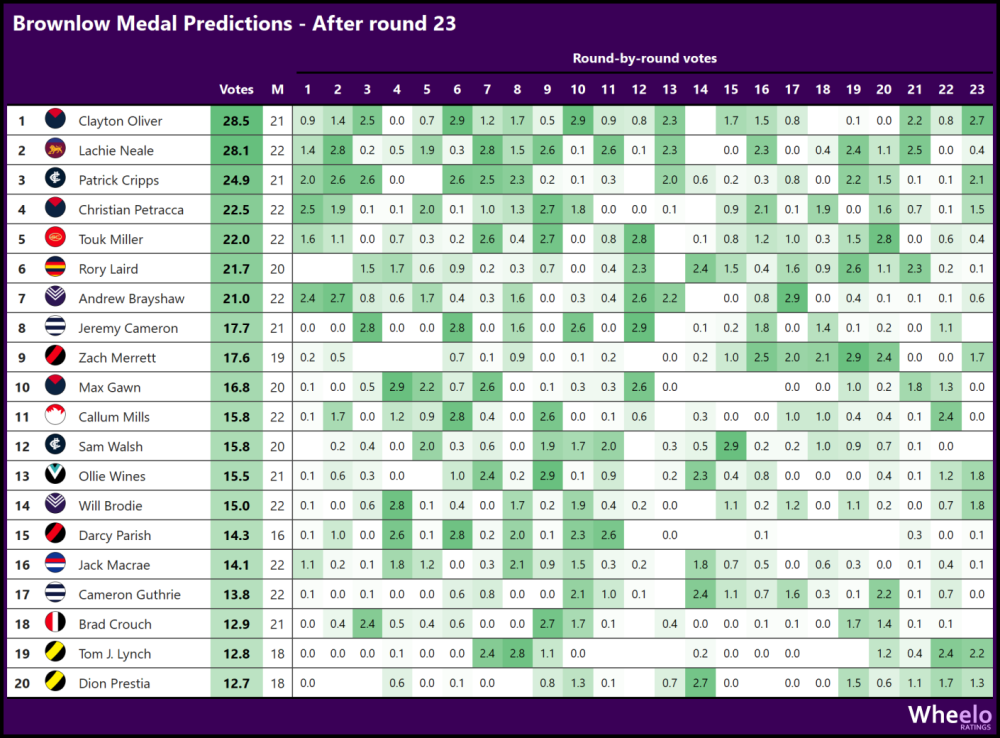
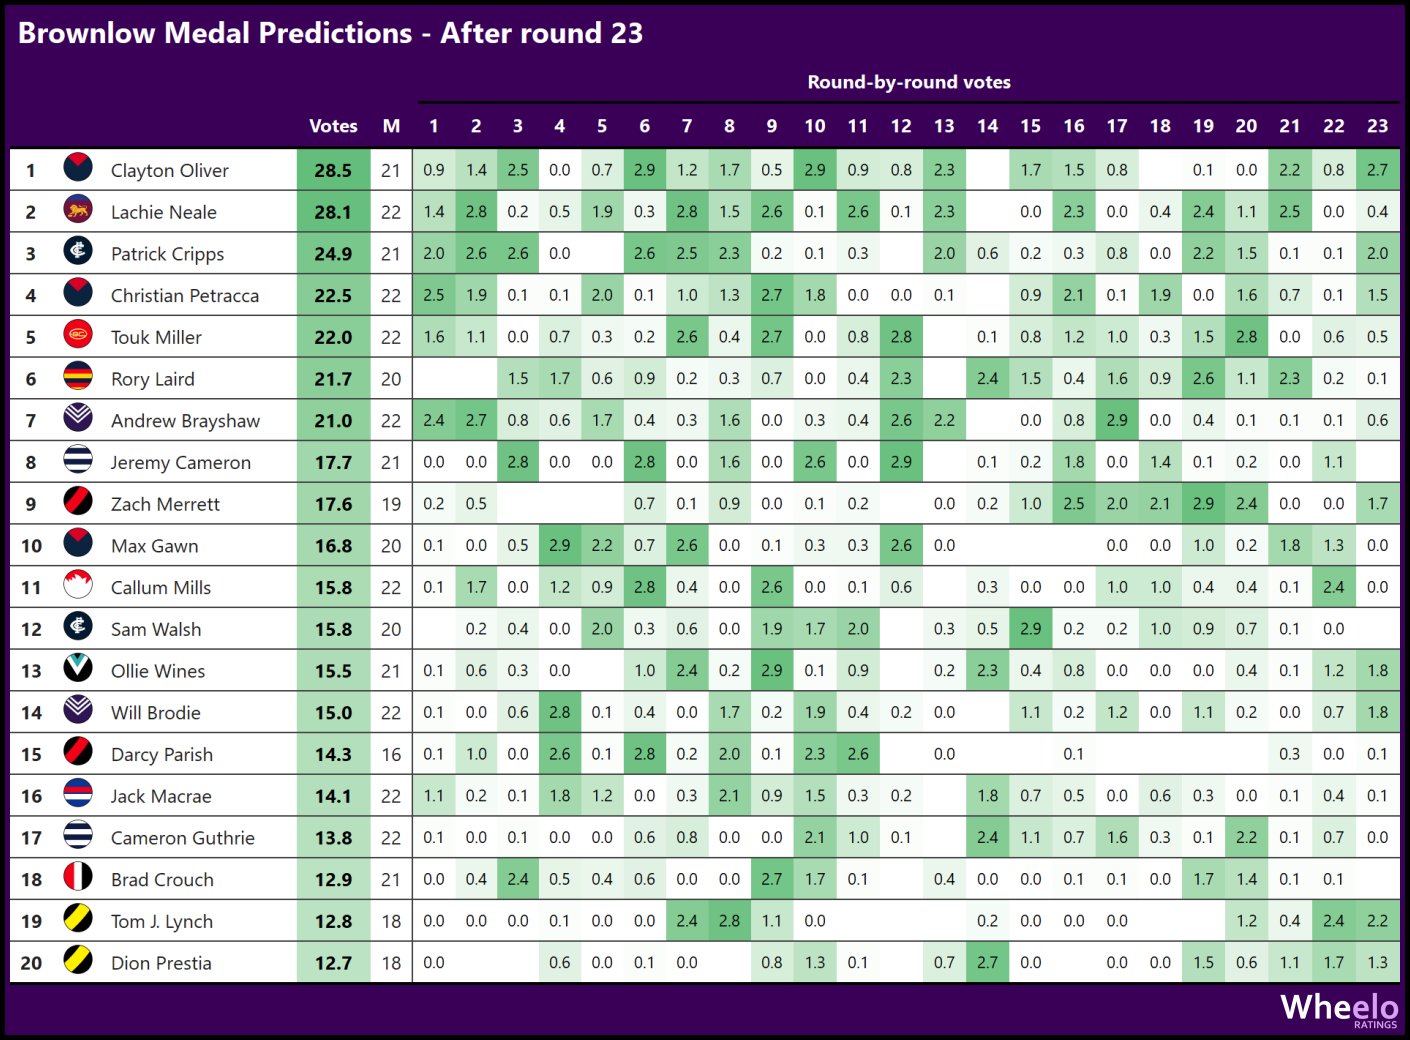
They generally didn't have consistently dominant players, at least statistically. That, and the fact they didn't have dominant wins, the team as a whole may not poll as many votes as a 16 win team would typically poll. I have Crisp and N. Daicos polling the most for Collingwood.Here are my model's predictions based on in-game statistics. https://www.wheeloratings.com/afl_brownlow.html
 Haha I'm not taking that bet! Binman said he'll discuss it on the podcast and he's a far better analyst of the game than I am 😉Yes it is interesting - I'm not sure whether it reflects a true improvement in accuracy or it's a reflection of location of shots being taken.Yes there have been some changes in the overall competition averages, but also the distribution of values for particular stats across the 18 teams may be different this year with two particularly weak teams this season. Here are some of the notable changes (in AFL-wide team averages) from 2021 (including finals) to 2022 to date: Goals up from 11.5 to 12.1 Shots at goal up from 24.3 to 24.8 Accuracy up from 47.4% to 48.7% Inside 50s up from 51.4 to 52.3 Metres gained up from 5542 to 5814 Metres gained per disposal up from 15.2 to 16.2 Clangers up from 57.1 to 60.2 Hit-outs up from 34.4 to 35.7 (due to an increase in ruck contests from 85.4 to 89.4) Uncontested possessions down from 223.9 to 217.3 One-on-one contests down from 17.3 to 15.3 Marks down from 94.6 to 92.1 Contested marks down from 11.5 to 10.7 Marks inside forward 50 down from 11.5 to 11.1 Marks on lead down from 7.9 to 7.3 Play on % from kick-ins up from 82.8% to 85.3%Just to add to my previous post, here is the summary for the past two home and away seasons for Melbourne.
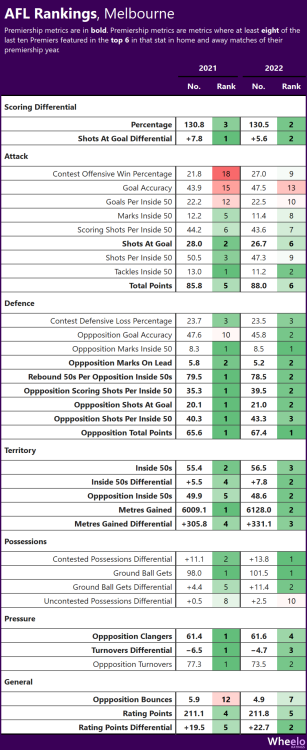 Thanks @binman I look forward to the discussion. I agree it wouldn't have much impact on the overall methodology.Thanks @Watson11 Yes that's definitely an issue. I guess the best you could do to minimise the effect of the uneven fixture is take the average of the double up matches so each team gets an average per opponent, then take an average across the 17 opponents.FWIW I have Clayton Oliver just ahead of Lachie Neale on my Brownlow Medal model predictions. It is only based on in-game statistics, not media/coaches votes so will be somewhat limited, but I think Oliver is definitely in with a shot. https://www.wheeloratings.com/afl_brownlow.html