


The big yardstick

Featured Replies
Featured Content
-
NON-MFC: Round 11
Round 11, the second week of The Sir Doug Nicholls Round, kicks off on Thursday night with the Cats hosting the Bulldogs at Kardinia Park. Geelong will be looking to to continue their decade long dominance over the Bulldogs, while the Dogs aim to take another big scalp as they surge up the ladder. On Friday night it's he Dreamtime at the 'G clash between Essendon and Richmond. The Bombers will want to avoid another embarrassing performance against a lowly side whilst the Tigers will be keen to avenge a disappointing loss to the Kangaroos. Saturday footy kicks off as the Blues face the Giants in a pivotal clash for both clubs. Carlton need to turn around their up and down season while GWS will be eager to bounce back and reassert themselves as a September threat. At twilight sees the Hawks taking on the Lions at the G. Hawthorn need to cement themselves in the Top 4 but they’ll need to be at their best to challenge a Brisbane side eager to respond after last week’s crushing loss to the Dees on their home turf. The first of the Saturday night double headers opens with North Melbourne up against the high-flying Magpies. The Roos will need a near-perfect performance to trouble a Collingwood side sitting atop the ladder.-
-
- 156 replies
-
-
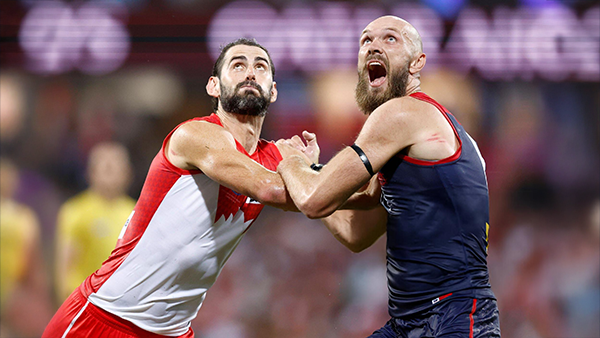
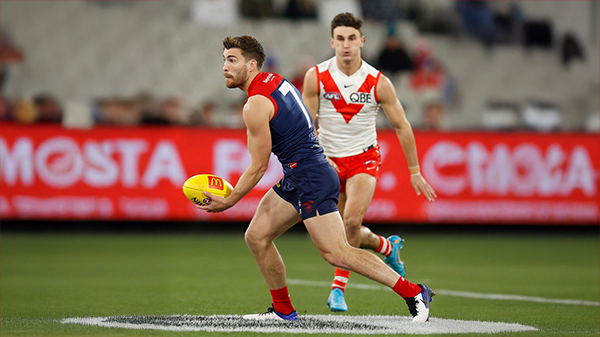
PREVIEW: Sydney
The two teams competing at the MCG on Sunday afternoon have each traversed a long and arduous path since their previous encounter on a sweltering March evening in Sydney a season and a half ago. Both experienced periods of success at various times last year. The Demons ran out of steam in midseason while the Swans went on to narrowly miss the ultimate prize in the sport. Now, they find themselves outside of finals contention as the season approaches the halfway mark. The winner this week will remain in contact with the leading pack, while the loser may well find itself on a precipice, staring into the abyss. The current season has presented numerous challenges for most clubs, particularly those positioned in the middle tier. The Essendon experience in suffering a significant 91-point loss to the Bulldogs, just one week after defeating the Swans, may not be typical, but it illustrates the unpredictability of outcomes under the league’s present set up.- 3 replies
-
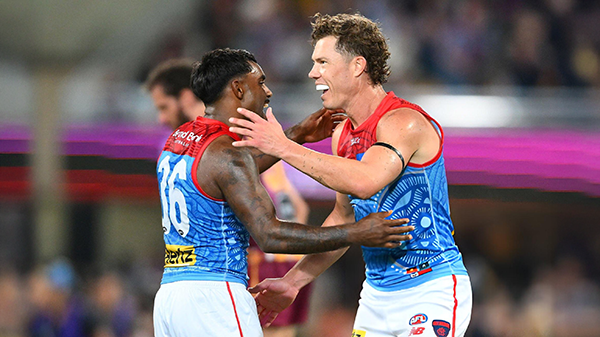
REPORT: Brisbane
“Max Gawn has been the heart and soul of the Dees for years now, but this recent recovery from a terrible start has been driven by him. He was everywhere again, and with the game in the balance, he took several key marks to keep the ball in the Dees forward half.” - The Monday Knee Jerk Reaction: Round Ten Of course, it wasn’t the efforts of one man that caused this monumental upset, but rather the work of the coach and his assistants and the other 22 players who took the ground, notably the likes of Jake Melksham, Christian Petracca, Clayton Oliver and Kozzie Pickett but Max has been magnificent in taking ownership of his team and its welfare under the fire of a calamitous 0-5 start to the season. On Sunday, he provided the leadership that was needed to face up to the reigning premier and top of the ladder Brisbane Lions on their home turf and to prevail after a slow start, during which the hosts led by as much as 24 points in the second quarter. Titus O’Reily is normally comedic in his descriptions of the football but this time, he was being deadly serious. The Demons have come from a long way back and, although they still sit in the bottom third of the AFL pack, there’s a light at the end of the tunnel as they look to drive home the momentum inspired in the past four or five weeks by Max the Magnificent who was under such great pressure in those dark, early days of the season.- 0 replies
-
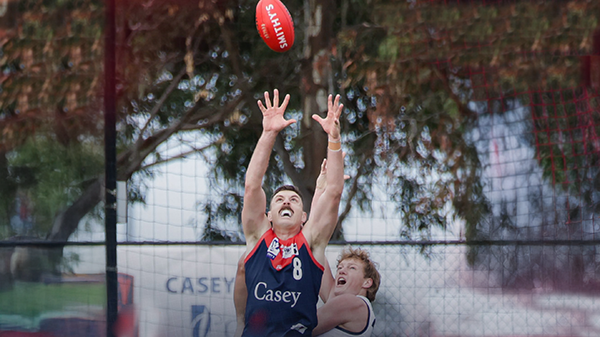
CASEY: Southport
The Southport Sharks came to Casey. They saw and they conquered a team with 16 AFL-listed players who, for the most part, wasted their time on the ground and failed to earn their keep. For the first half, the Sharks were kept in the game by the Demons’ poor use of the football, it’s disposal getting worse the closer the team got to its own goal and moreover, it got worse as the game progressed. Make no mistake, Casey was far and away the better team in the first half, it was winning the ruck duels through Tom Campbell’s solid performance but it was the scoreboard that told the story.- 3 replies
-
PREGAME: Sydney
Just a game and percentage outside the Top 8, the Demons return to Melbourne to face the Sydney Swans at the MCG, with a golden opportunity to build on the momentum from toppling the reigning premiers on their own turf. Who comes in, and who makes way?-
-
- 352 replies
-
-
PODCAST: Brisbane
The Demonland Podcast will air LIVE on Monday, 12th May @ 8:00pm. Join Binman, George & I as we analyse a famous victory by the Demons over the Lions at the Gabba.
Your questions and comments are a huge part of our podcast so please post anything you want to ask or say below and we'll give you a shout out on the show.
Listen LIVE: https://demonland.com/-
-
- 35 replies
-


|

|

|

|
 |
 |
 |
 |
 |
 |
 |
 |
Archived
This topic is now archived and is closed to further replies.